Brief
Our client was Craftzing, and the topic was growing up with screens: children from 0 to 6. Screens are part of almost every family routine now. They give parents a few minutes of peace, but parents also worry about sleep, attention, emotions and how their child develops. The tools that exist, like parental controls, are complicated and mostly made with older kids in mind.
This was a research project, not an app. Before anyone designs something for these parents, the client wanted to know how they actually make decisions about screens.
We were three, and it was a big one: over 10 weeks we ran a survey with 51 parents, 10 interviews and cultural probe boxes. We did the research together, and inside that I was in charge of the survey: I built it in Jotform, kept updating it as our questions changed, went looking for parents to fill it in, and kept an eye on the submissions. The idea for how we presented it, and most of the website design, were mine.
Process
Starting broad
We started with desk research: how screens affect children’s physical, cognitive and emotional development, the official screen-time recommendations per age, and statistics on how much screen time parents actually allow. That gave us our first assumptions to test.
Finding the question
Our first idea was about what screens do to children. The more we read, the more we realised the missing piece was the parents: what they do with all that information, and why they allow, limit or change screen time.
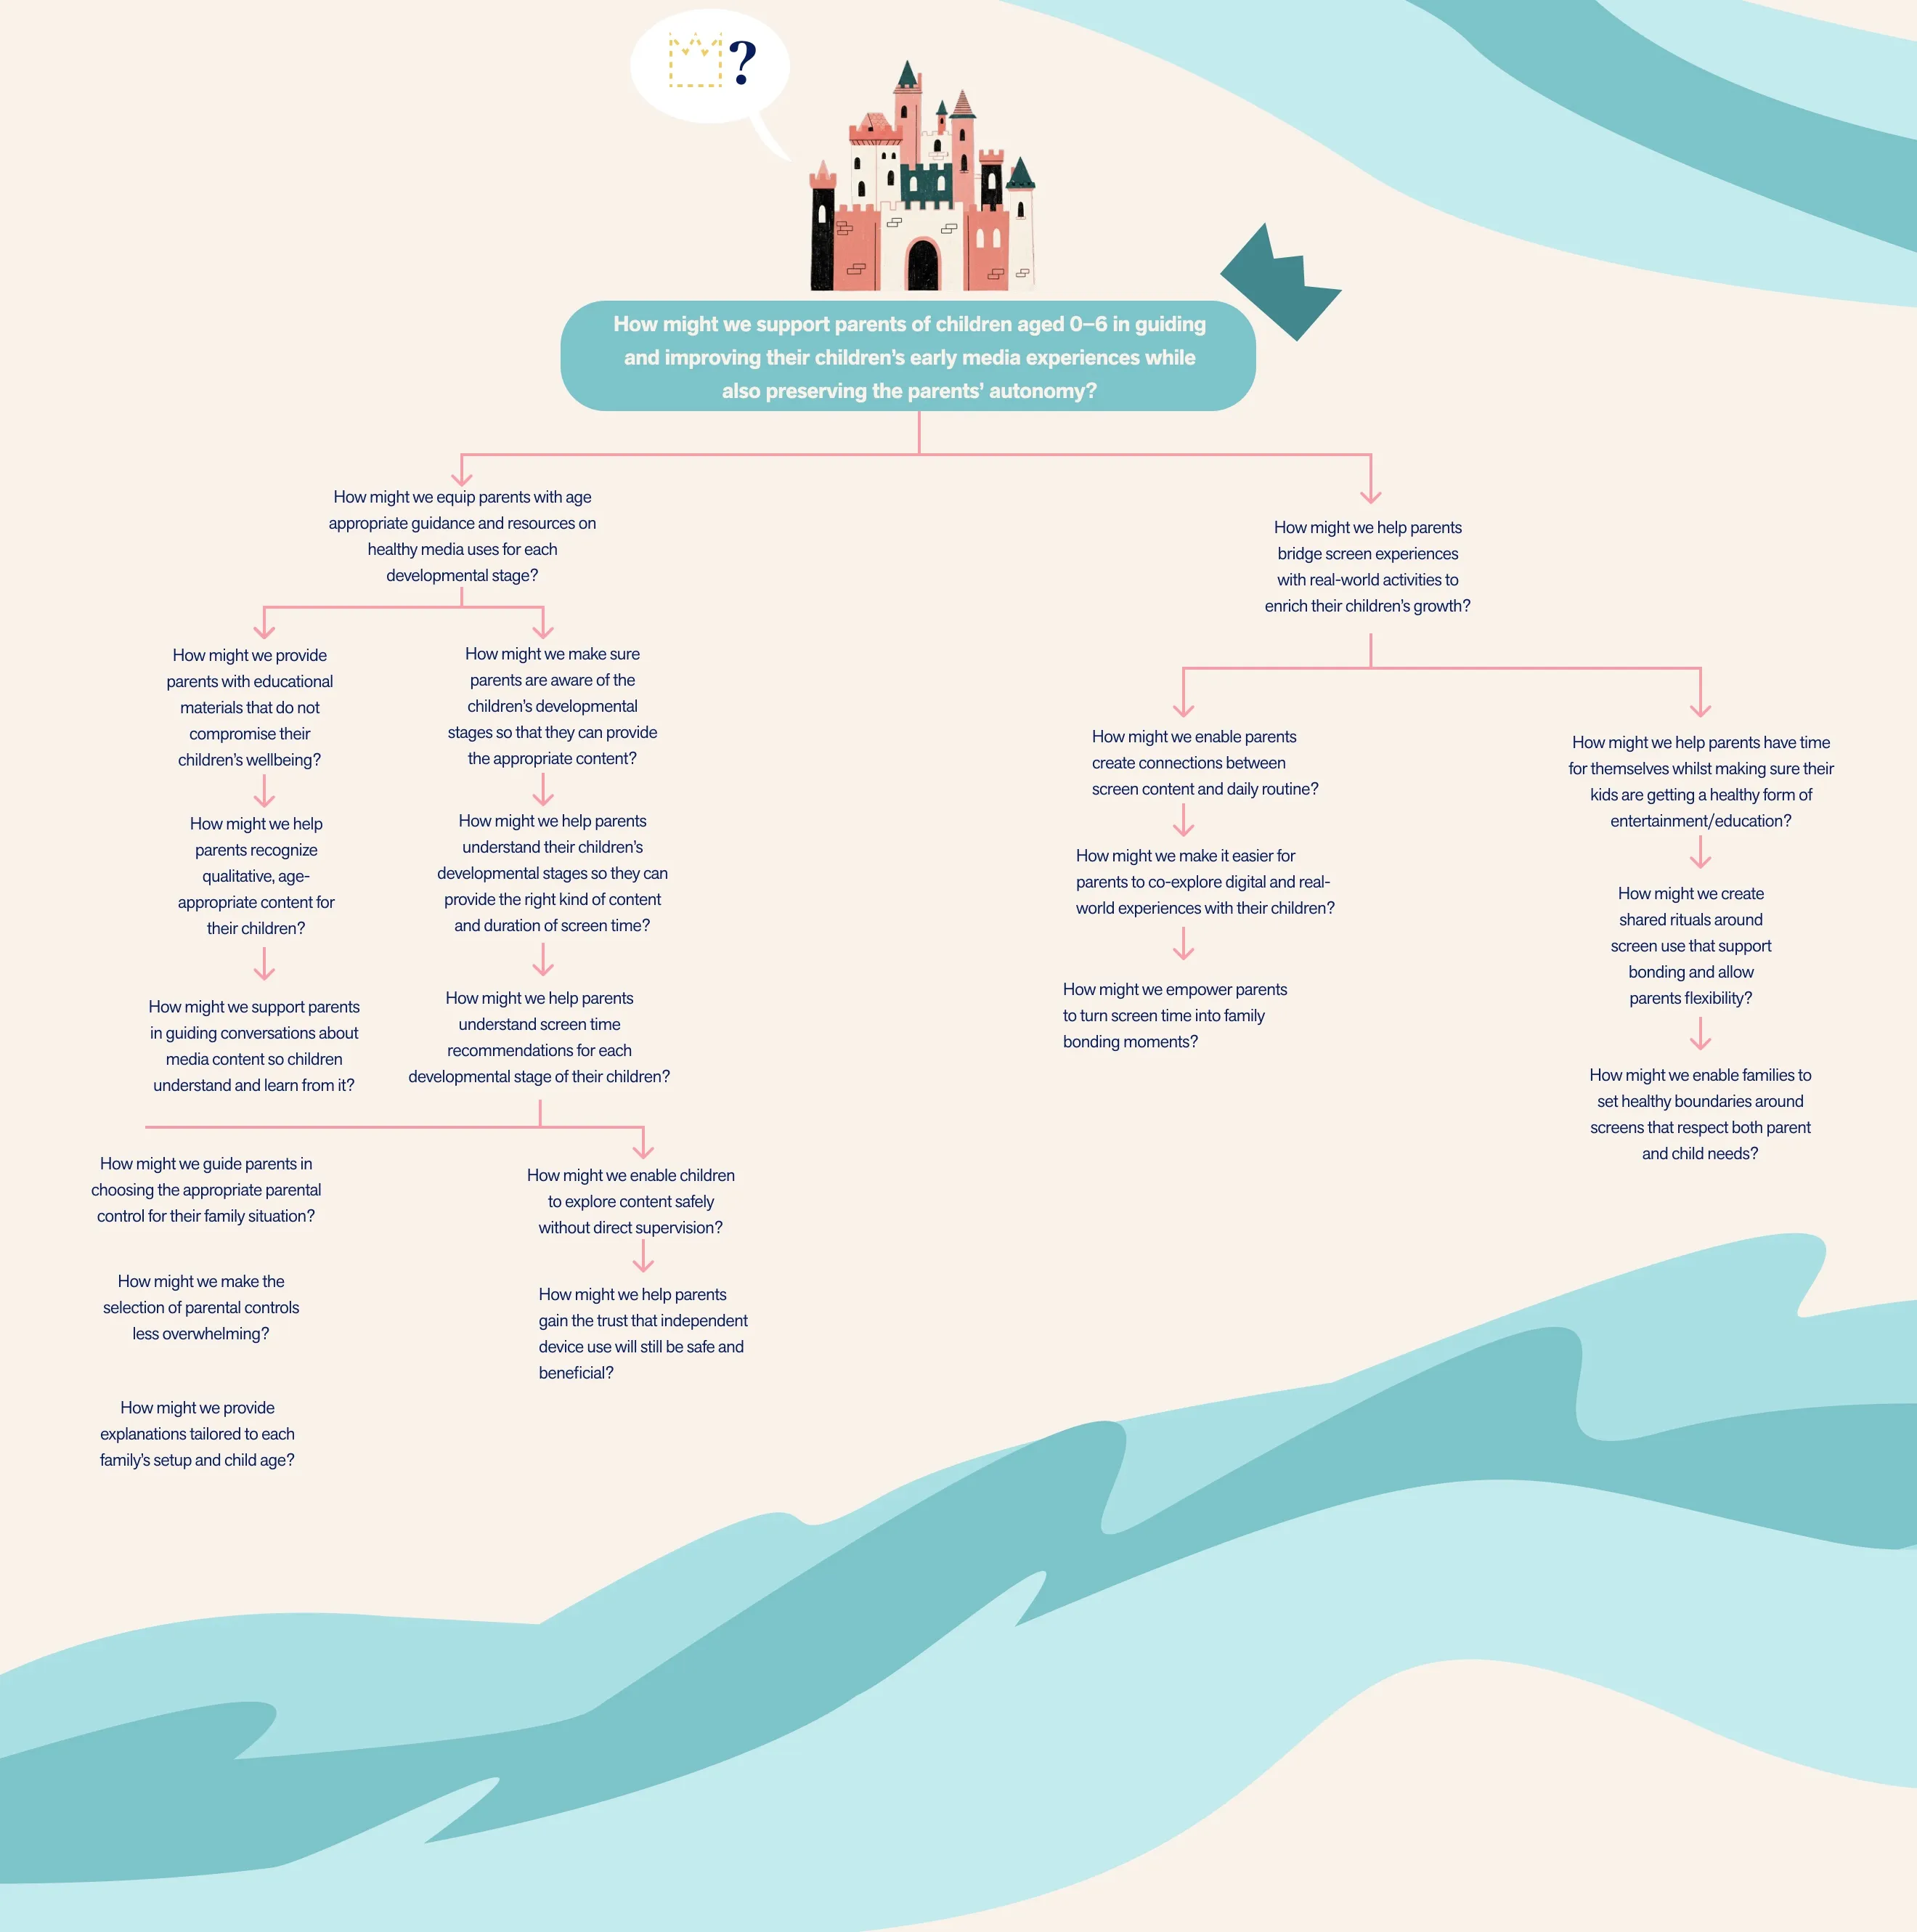
We used an issue tree to break one big “How might we” question into smaller ones, about guidance, routines, parents’ freedom, developmental stages, content and parental controls. A lot of them ended up being about how to give parents the right knowledge, but we still didn’t have a research question.
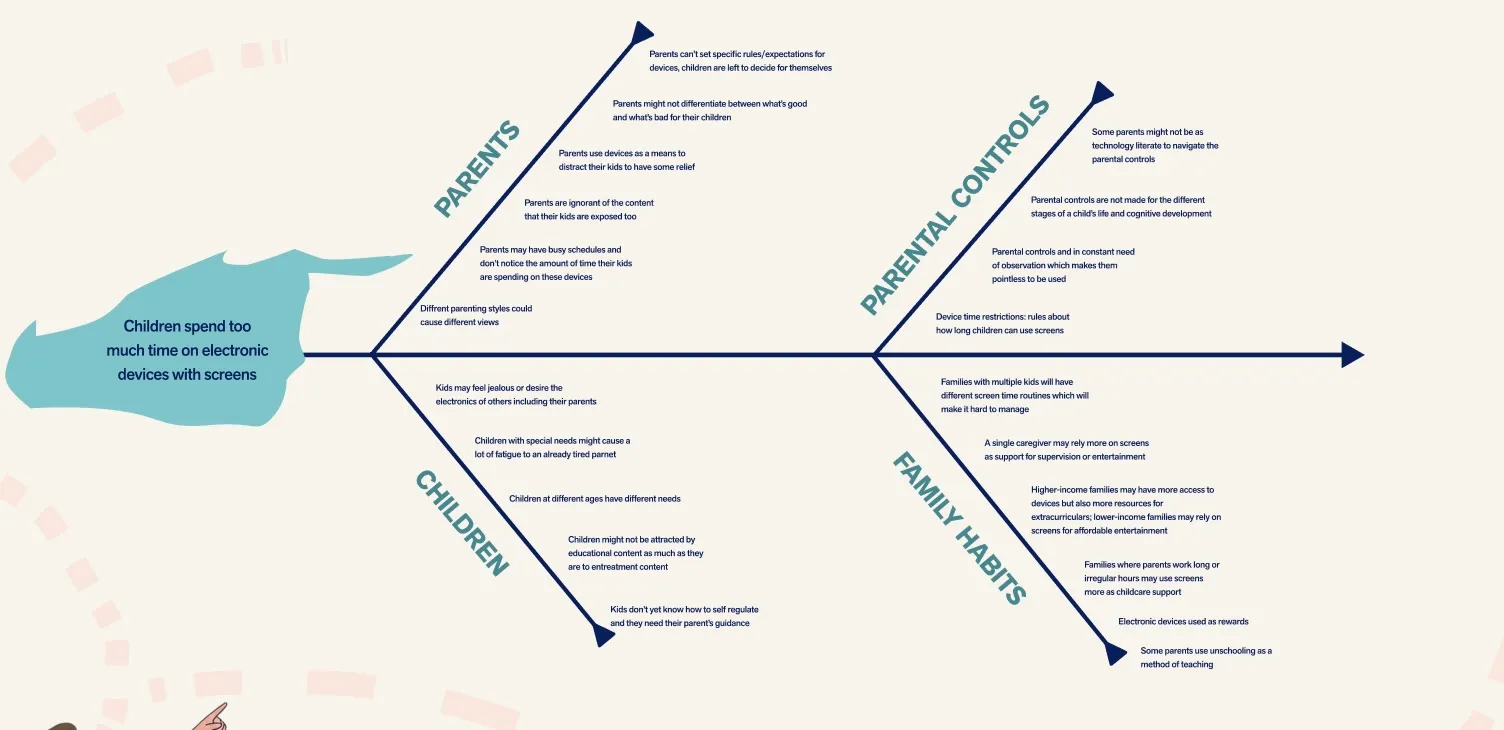
Then we made an Ishikawa diagram (on our site, the dragon diagram), starting from “children spend too much time on screens” and tracing it back to four groups of causes: parents, children, parental controls and family habits. That’s what moved us from screen time itself to how parents decide.
Our final research question:
What are the reasons parents adjust screen time for their child(ren), and what are the driving factors that influence their decisions?
What we didn’t know yet
We wrote down every question we wanted answered and every assumption we had, and grouped them into five themes: family and parenting, controls and monitoring, knowledge, impacts, and awareness. Then we put the assumptions on a matrix of how important and how certain they were, and focused on the ones that were important but still a guess.
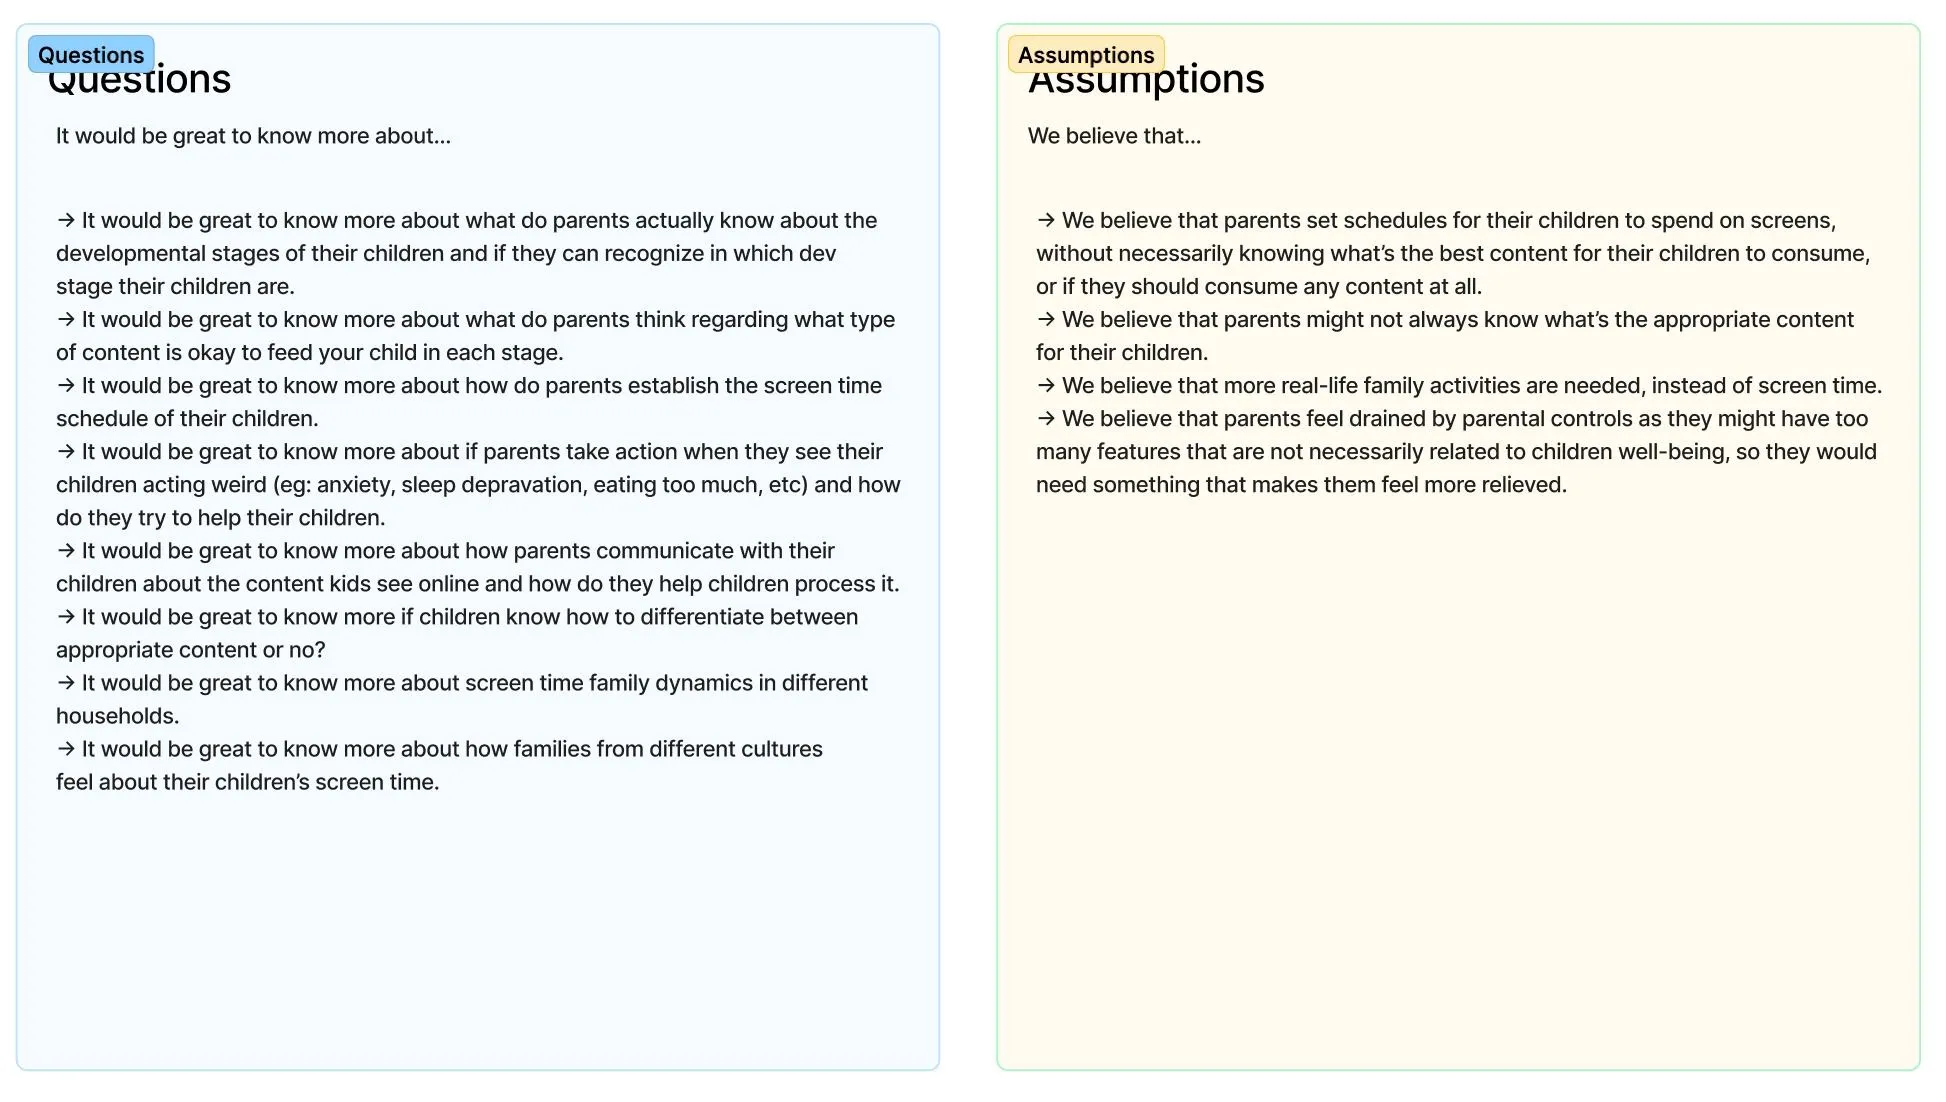
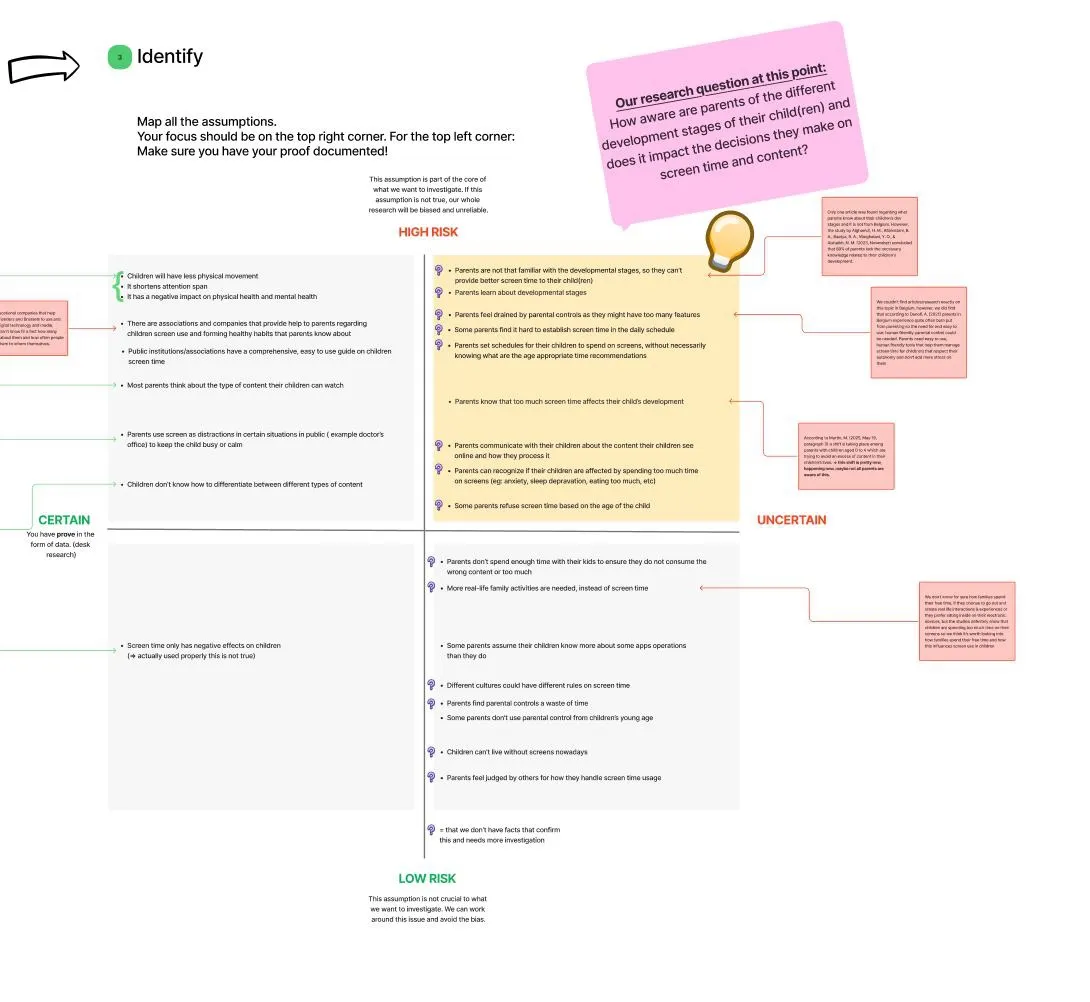
Our questions and assumptions, and the matrix we sorted them on.
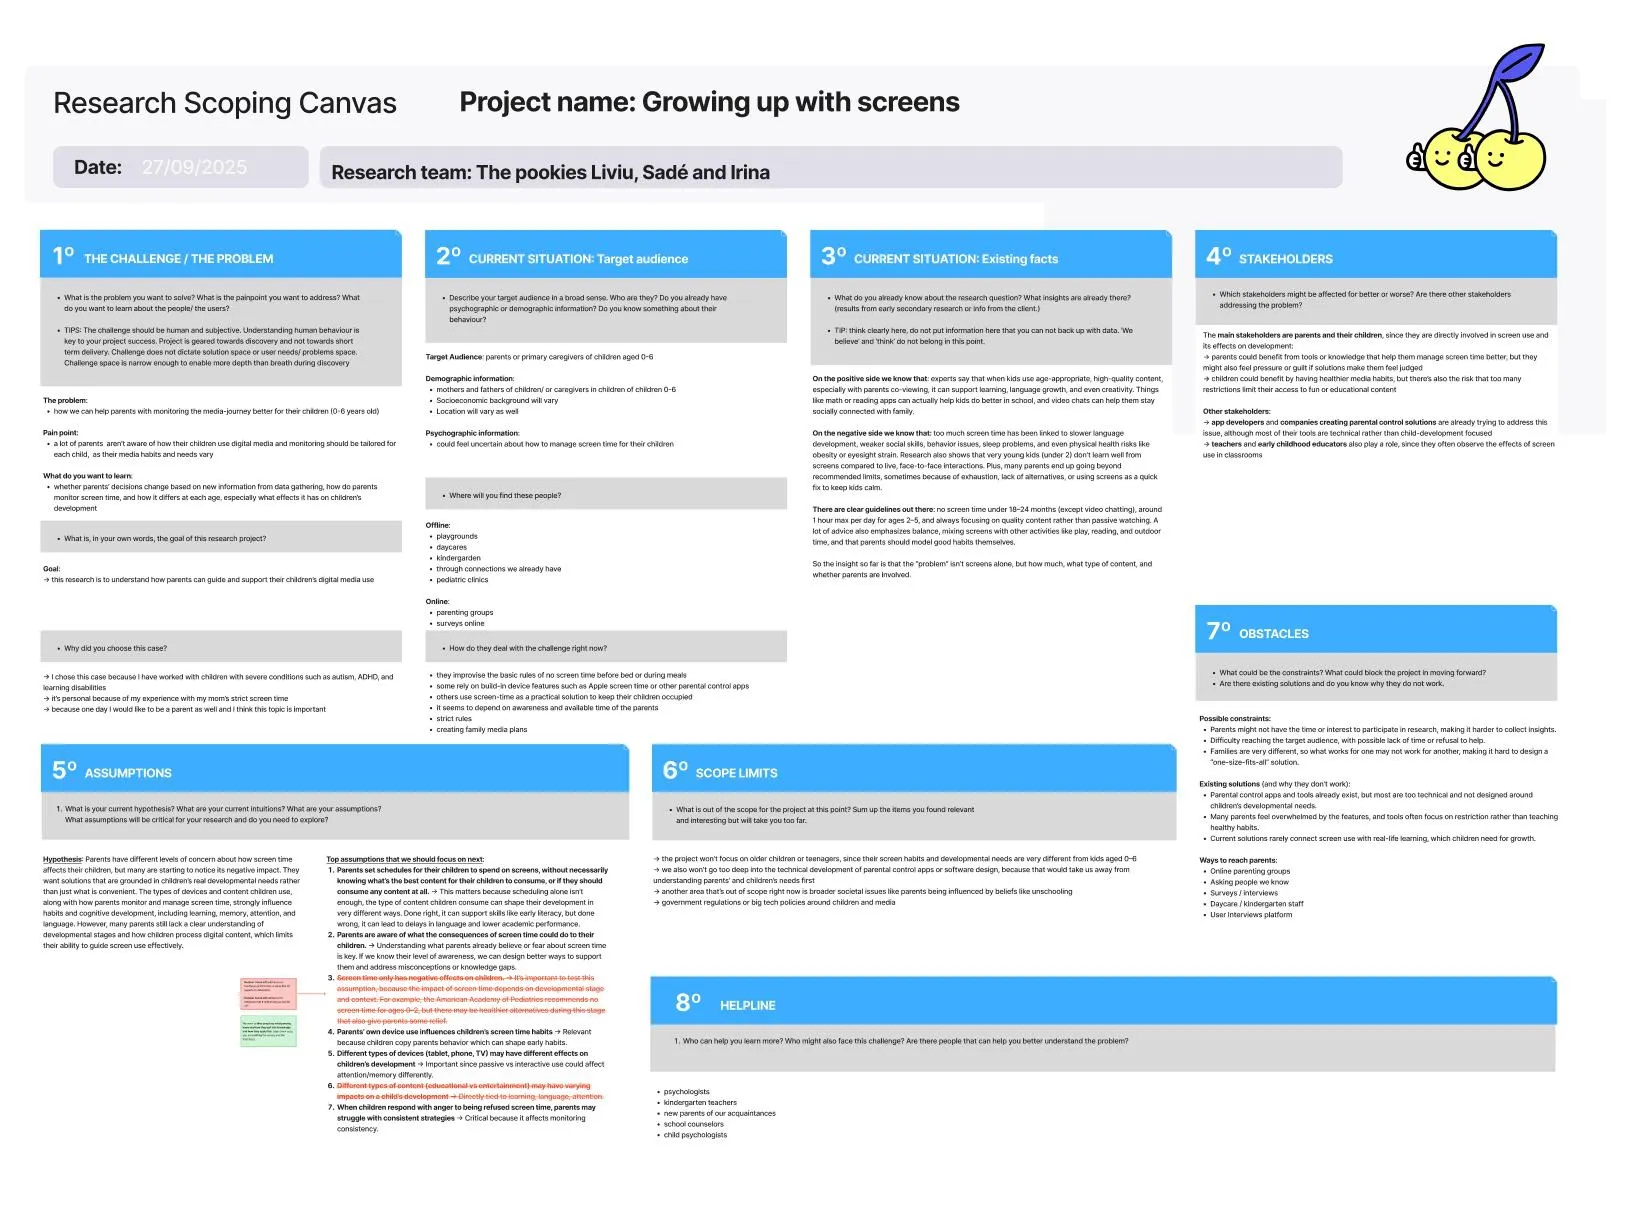
A scoping canvas helped us decide what exactly we were trying to solve. The biggest takeaway: most of our assumptions about parents couldn’t be checked without talking to families, so that’s what came next.
Who the parents are
We defined our user group: mostly mothers between 30 and 40 in Flanders and Brussels, with lower to middle incomes, who question how much screen time their kids get and are trying to set some kind of schedule. We also used the Noob–Nerd spectrum (in our story, the Squire and the Hero): from parents who feel overwhelmed by digital tools to parents who are very confident with them.
We mapped everyone around these parents, from Kind & Gezin, Gezinsbond and Yapaka to paediatricians, teachers, grandparents and other parents, and sorted them on a power–interest matrix.
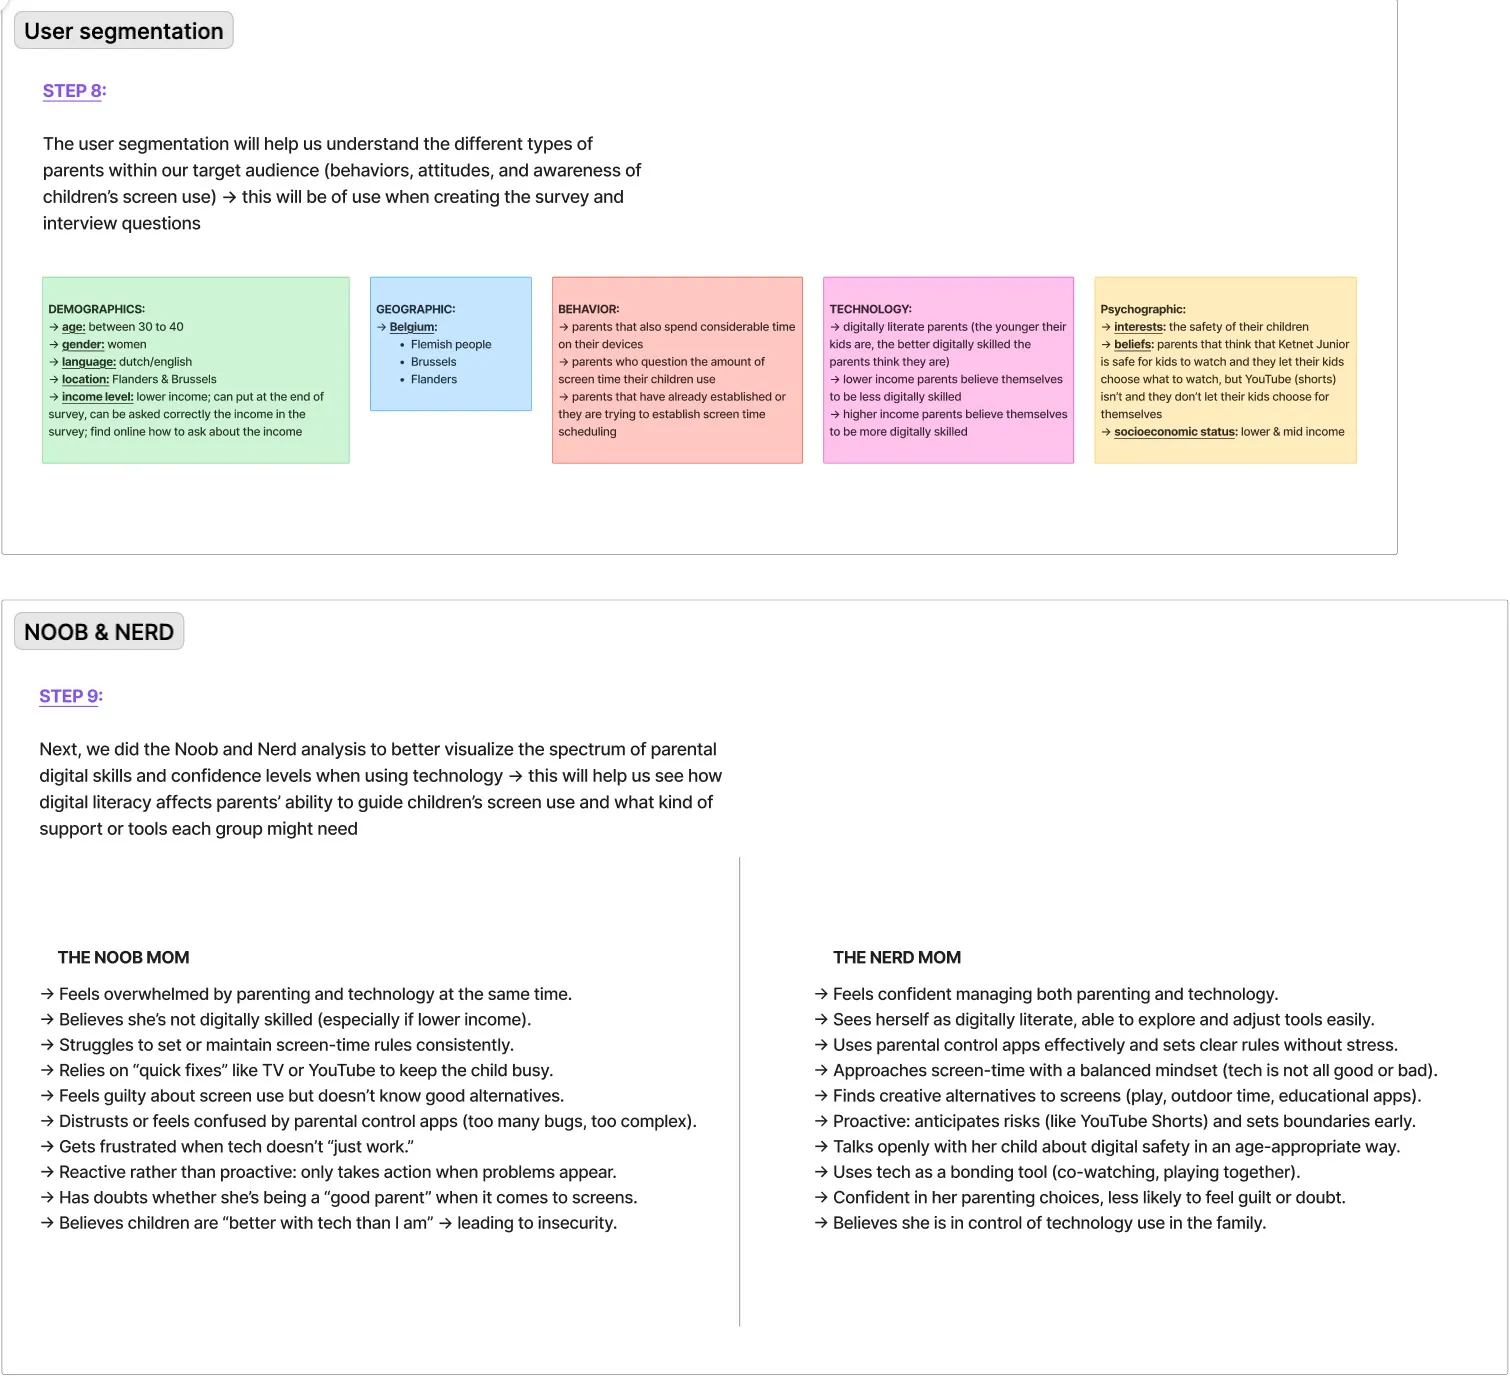
User segmentation, and the Noob and Nerd mom.
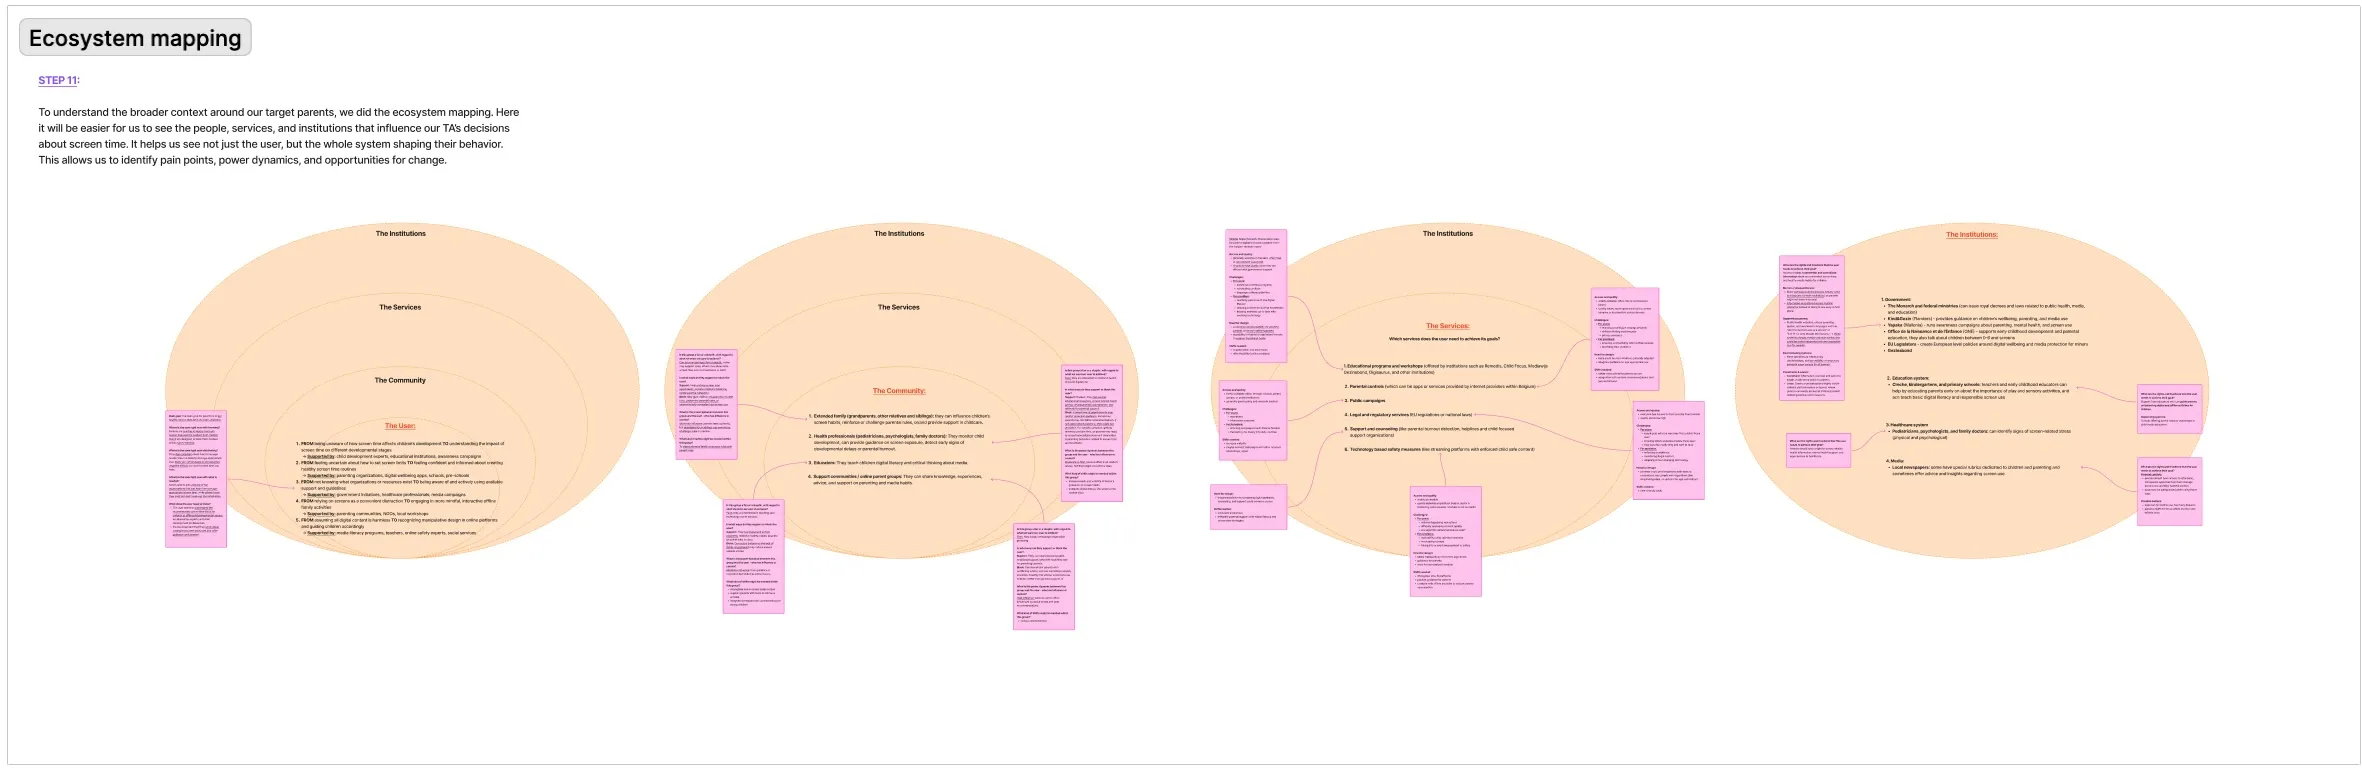
The ecosystem around the parents, from family to institutions.
In class we also made a persona with AI, Sofie, a mum of two in Ghent. She wasn’t real, but she helped us think like our target group before writing the survey and interview questions.
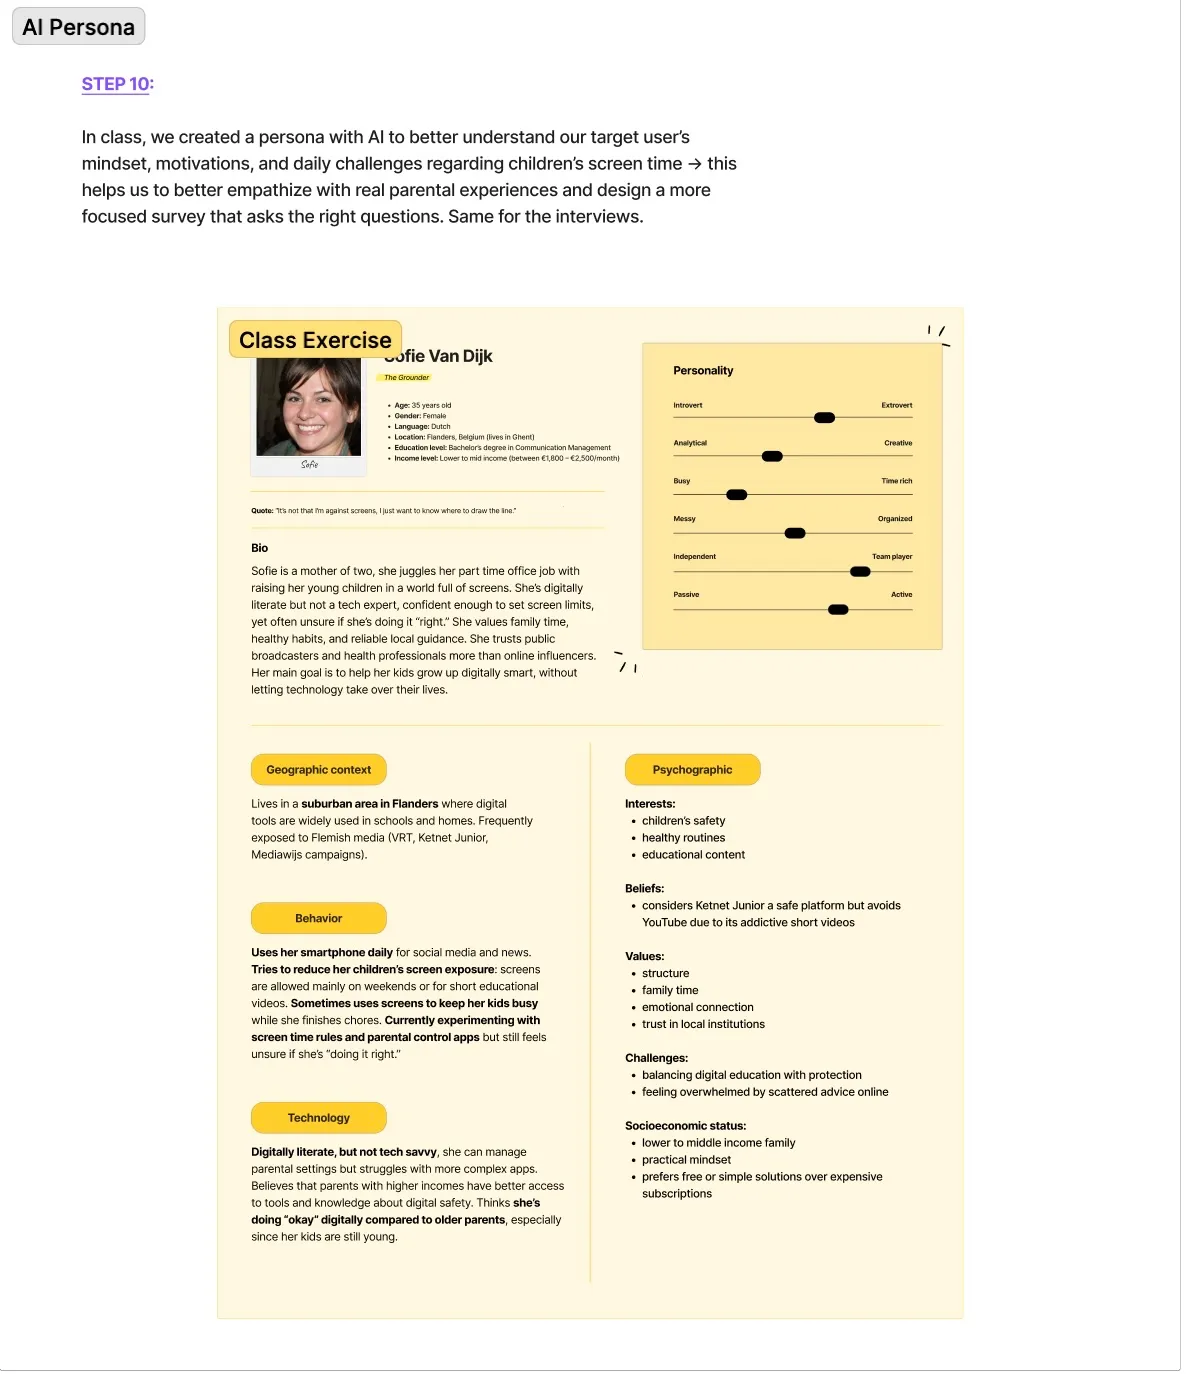
Sofie, the persona we made with AI in class.
The survey
This was my part. Before writing any questions, we went back to our riskiest assumptions and turned each one into a test card: what we believe, how we’ll test it, what we’ll measure, and what would prove us right. That way every question in the survey had a reason to be there.
The survey had five sections: background (household, family setup, digital skills), screen-time management, parental controls, where parents get support, and reflections on what they’d want in the future. I built it in Jotform and kept changing it as the questions got sharper, then went looking for parents to fill it in. While it was running I monitored the submissions and removed the spam ones from trolls, so they wouldn’t mess up the results. In the end, 51 parents answered.
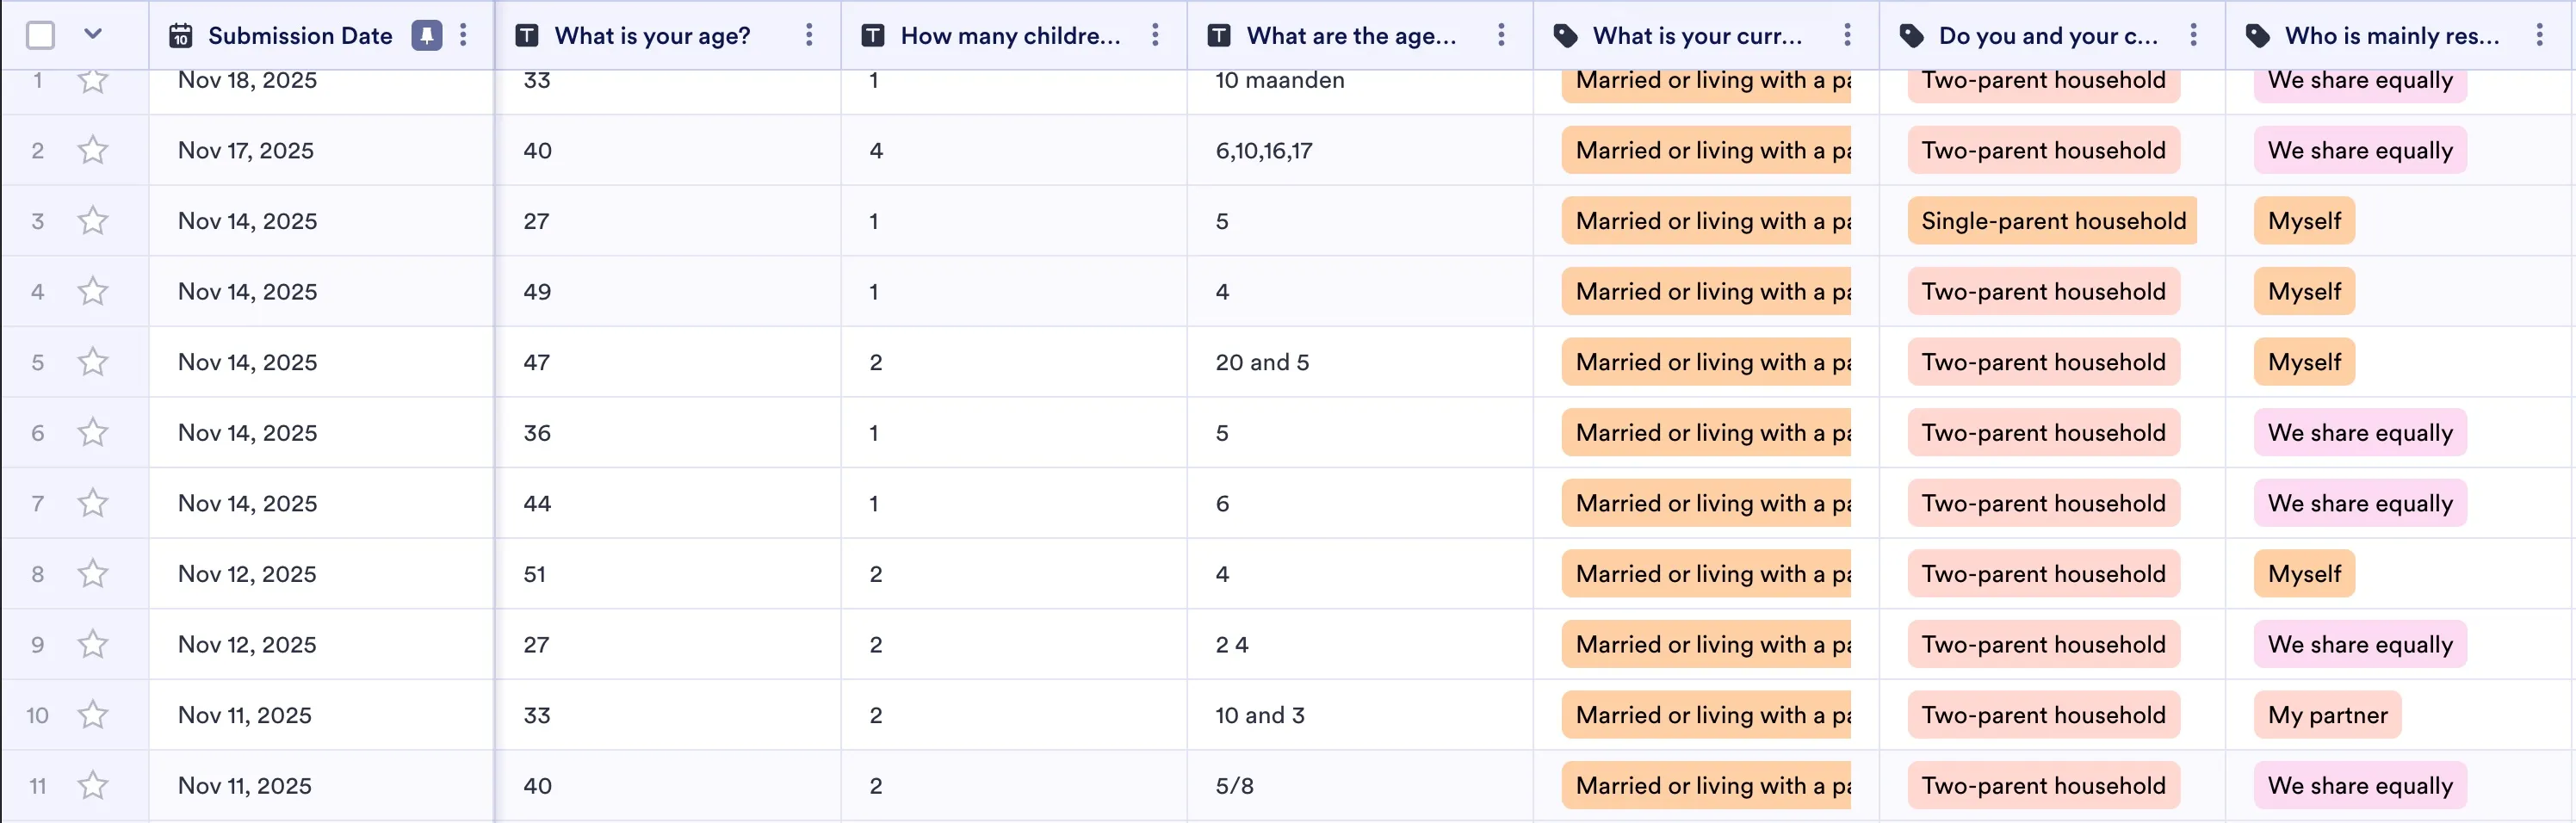
Part of the Jotform submissions I kept an eye on.
What the answers showed:
- Single parents don’t clearly allow more screen time. We assumed they would, but the survey didn’t support it. Only 8 of the 51 were single parents, though, so that comparison is weak.
- Lower-income families do allow more. That one held up.
- Older children generally get more. The median was 90 minutes a day at ages 4–5 and 6+, while the younger ages mostly stayed between 15 and 52 minutes.
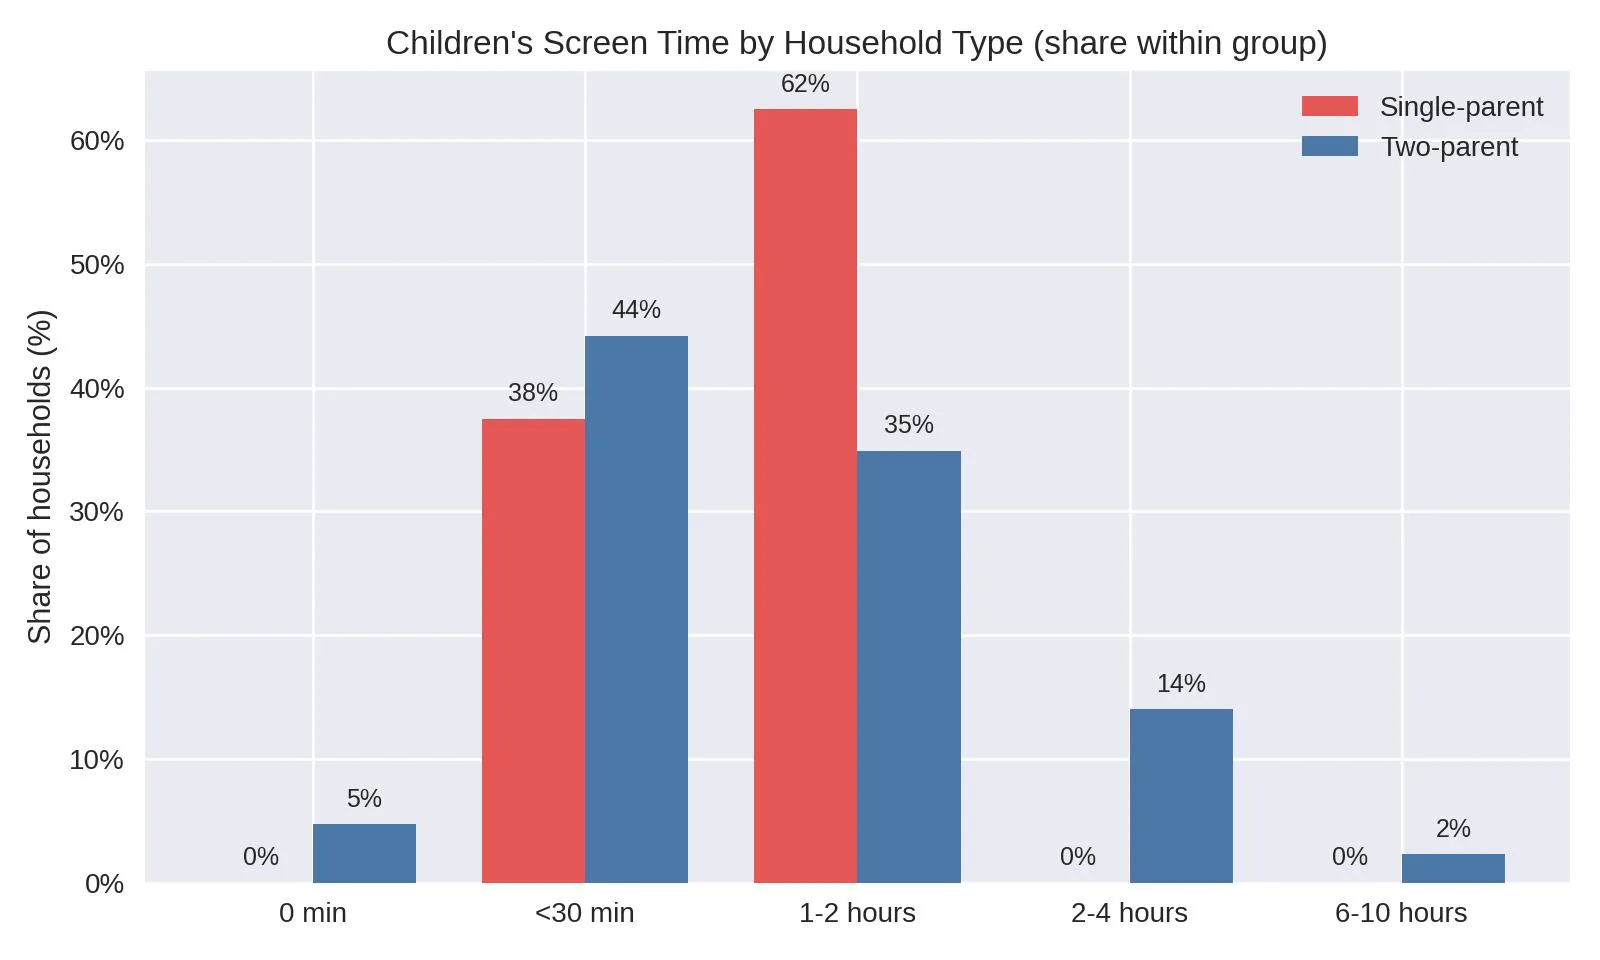
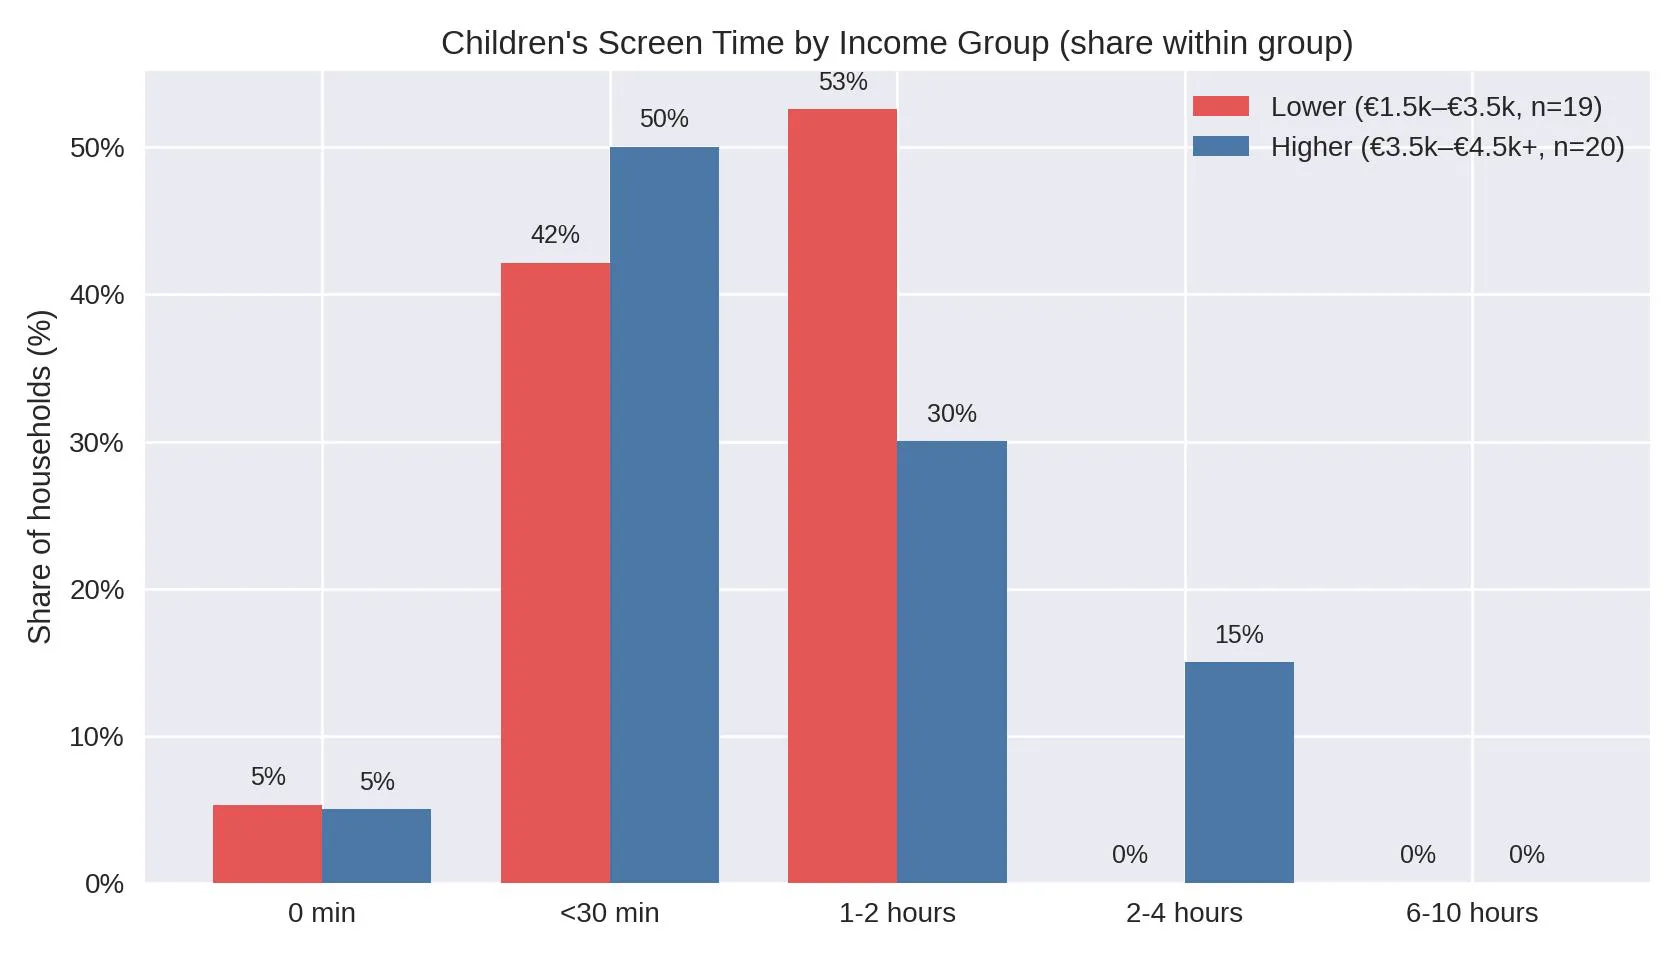
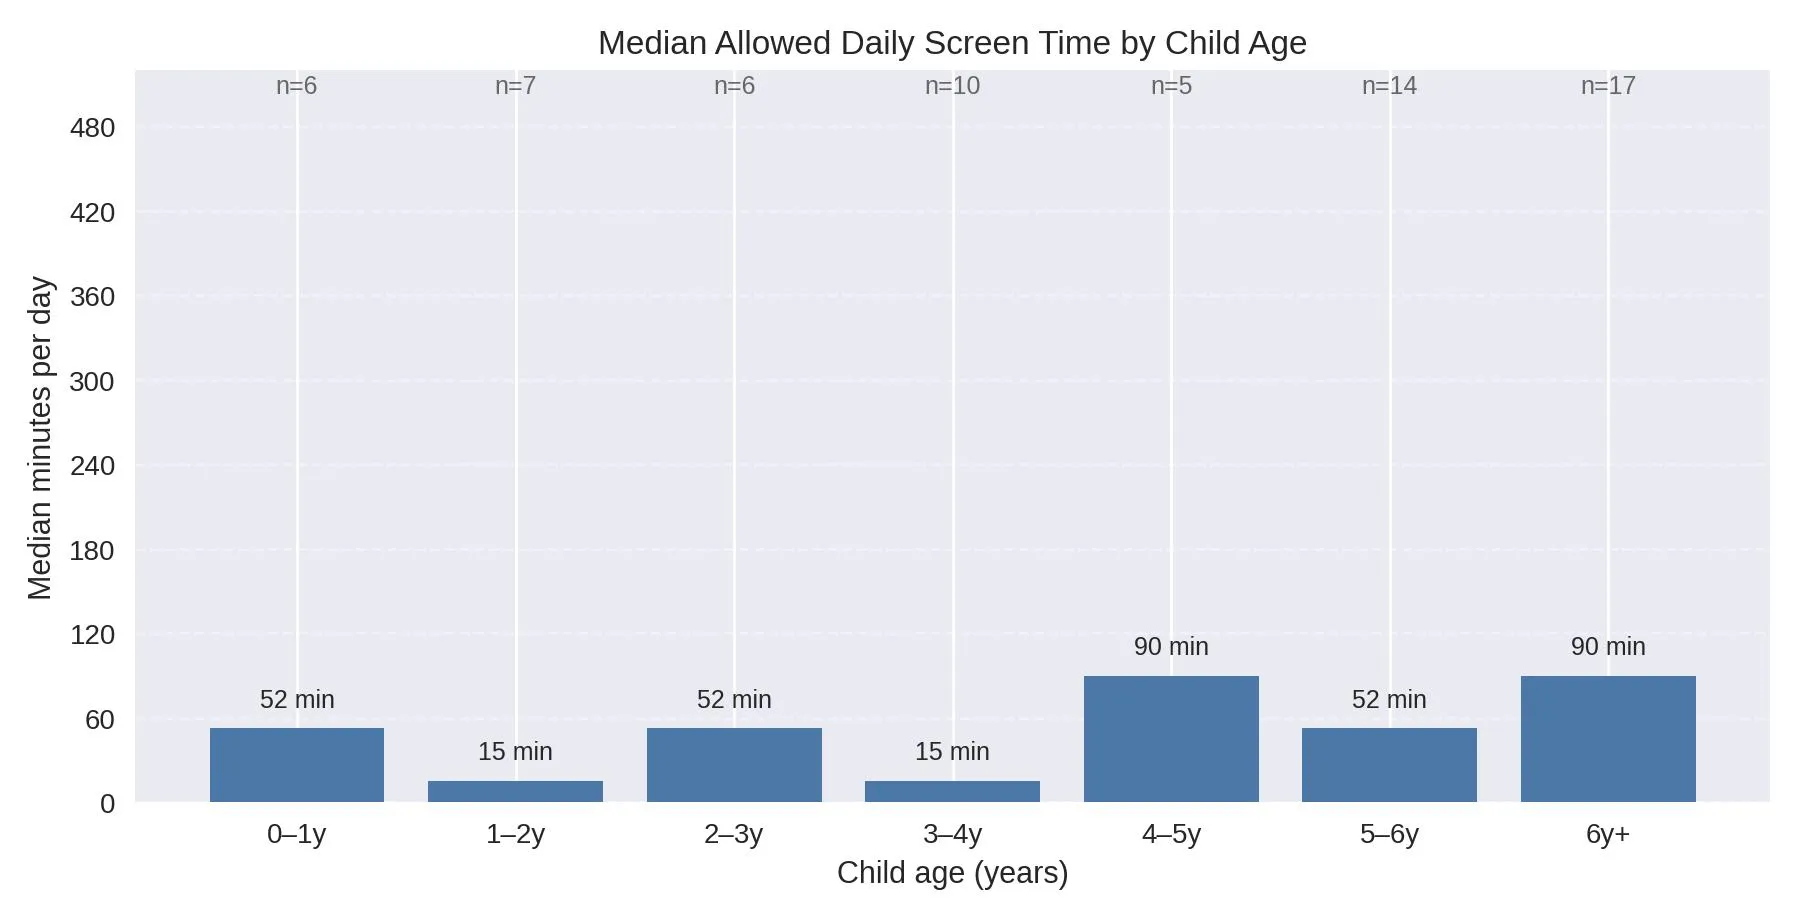
Three of the survey results: by household type, by income and by the child's age.
Interviews and the probe box
Next to the survey, we interviewed 10 parents and sent out cultural probe boxes, so we’d see real moments over several days instead of only what parents remember afterwards.
From the interviews we found seven patterns: health and routines, digital discipline, who parents trust, their own beliefs (TV feels safer than a tablet because it’s easier to supervise), screens as a quick fix in stressful moments, screens as a reward, and exceptions to the rules on weekends, trips or sick days.
The probe showed that parents aren’t careless about screens at all. They think about it a lot and feel guilty, but they don’t get much guidance that fits their real day.
Our users
From the interviews and probes we made a user card for each of the ten parents we talked to, so these are real people, not made-up personas. Each one got a title that fits our story. For example “The Synapsifier Genie”, a research-driven mum of two who keeps screens to 30 minutes, watches everything with her kids and stops to talk about it. We also mapped a full day in their life, from morning to bedtime, and when screens come in.
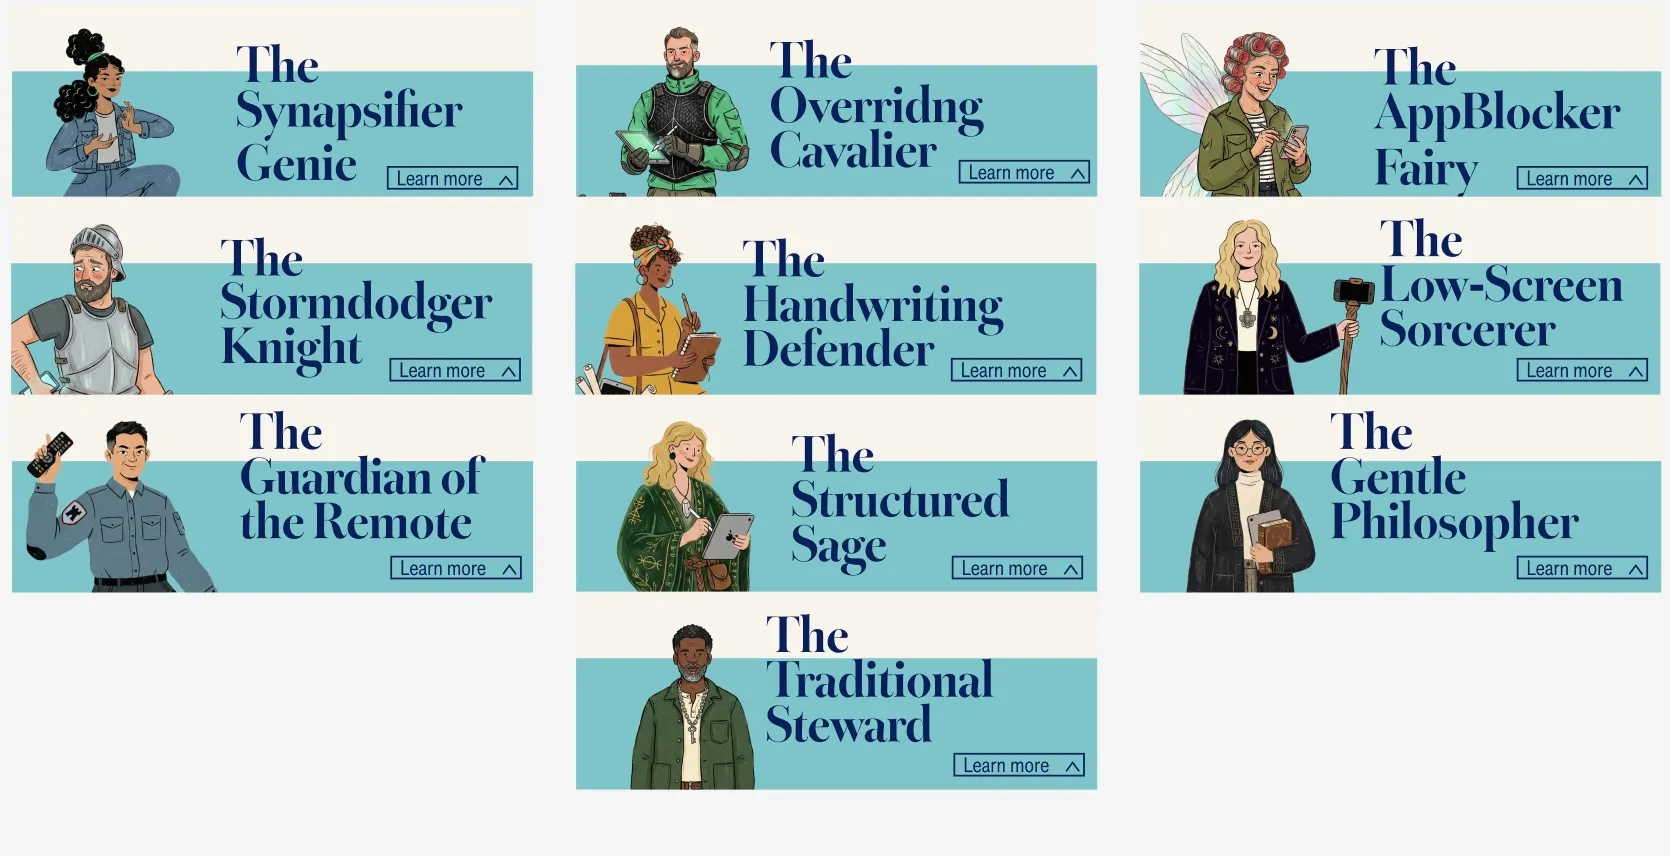
One card for each parent we interviewed.
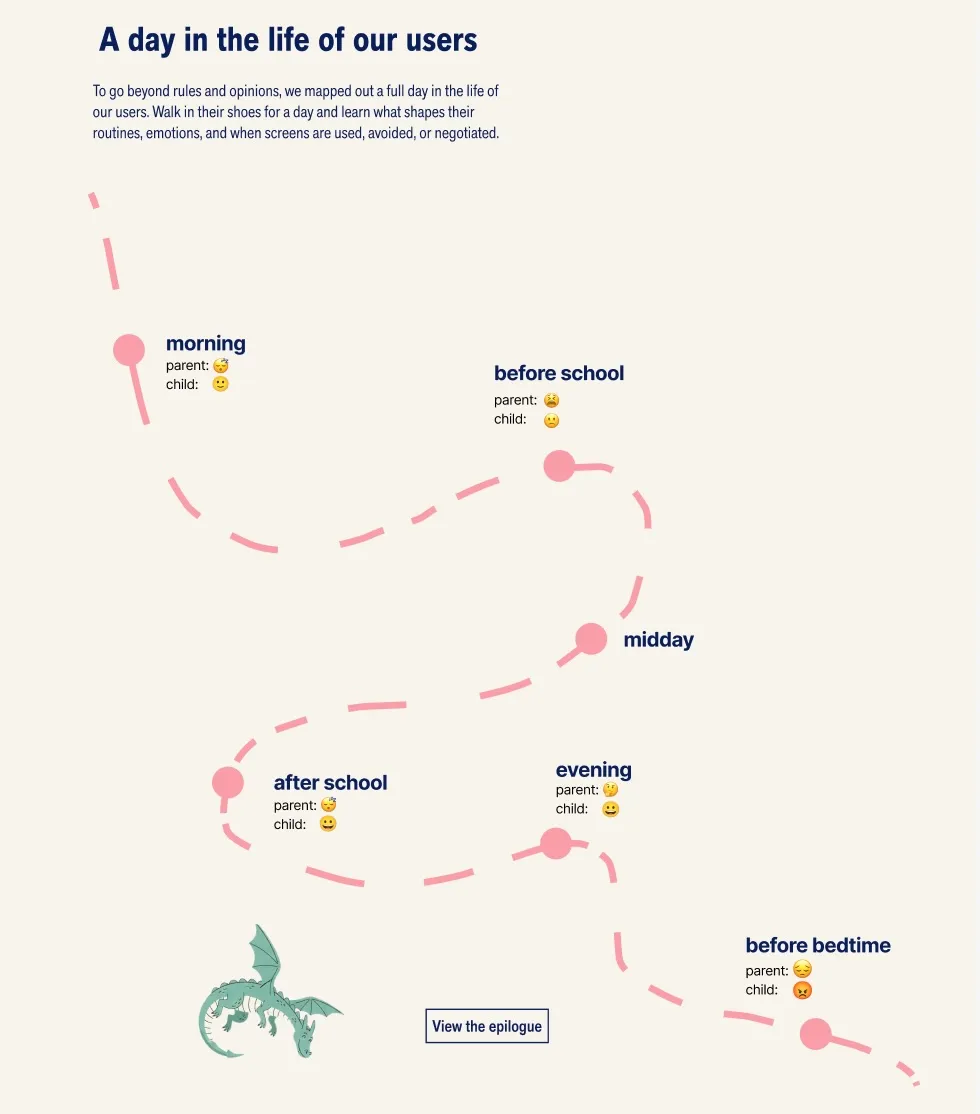
A day in the life, and how parent and child feel along the way.
Result
We presented everything as a storybook website, and that idea was mine from start to finish. The parents are the knights, the balance they’re looking for is the princess, screens are the dragon, and the town is the home and the kids. The research is told as the quest, chapter by chapter, from the prologue to the end. I also designed most of the website, including its more playful and interactive parts. The illustrations on the site are AI-generated; the concept, the story and how each page works are ours.
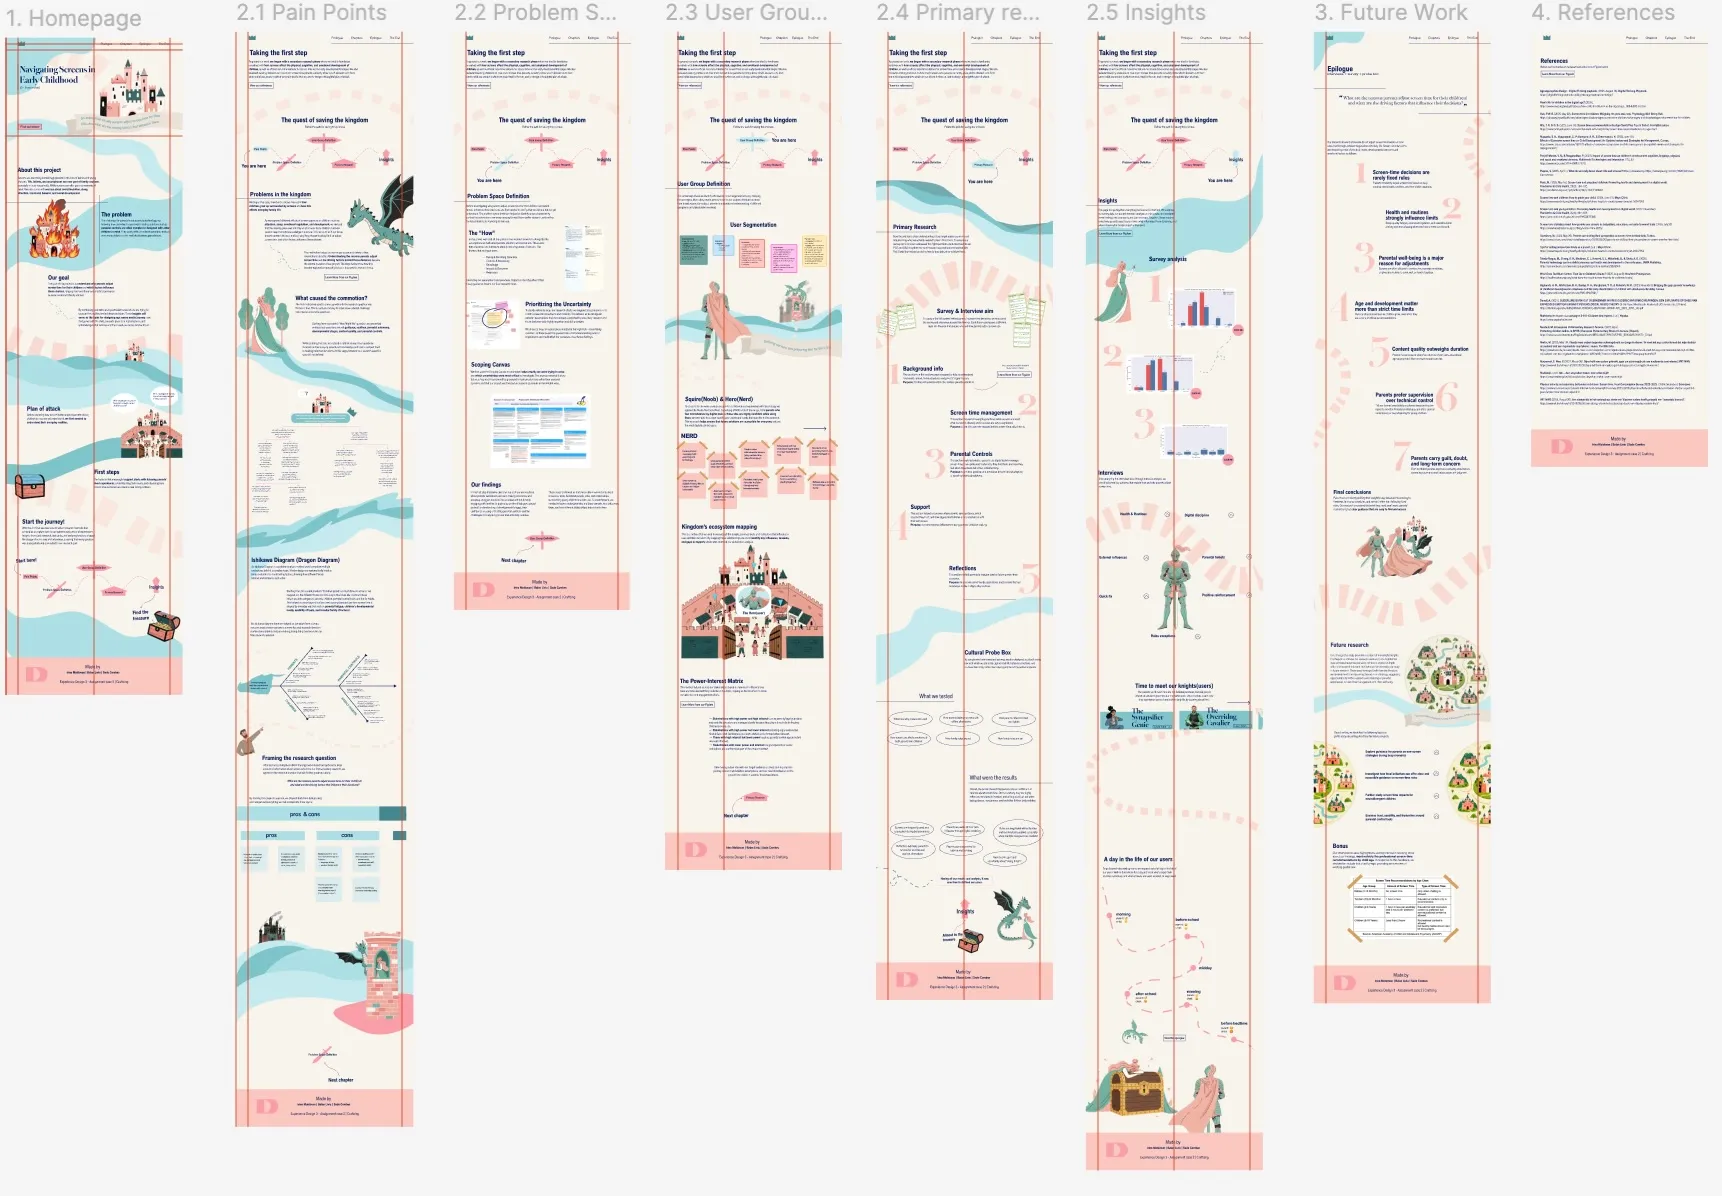
The whole website in Figma, from the homepage to the references.
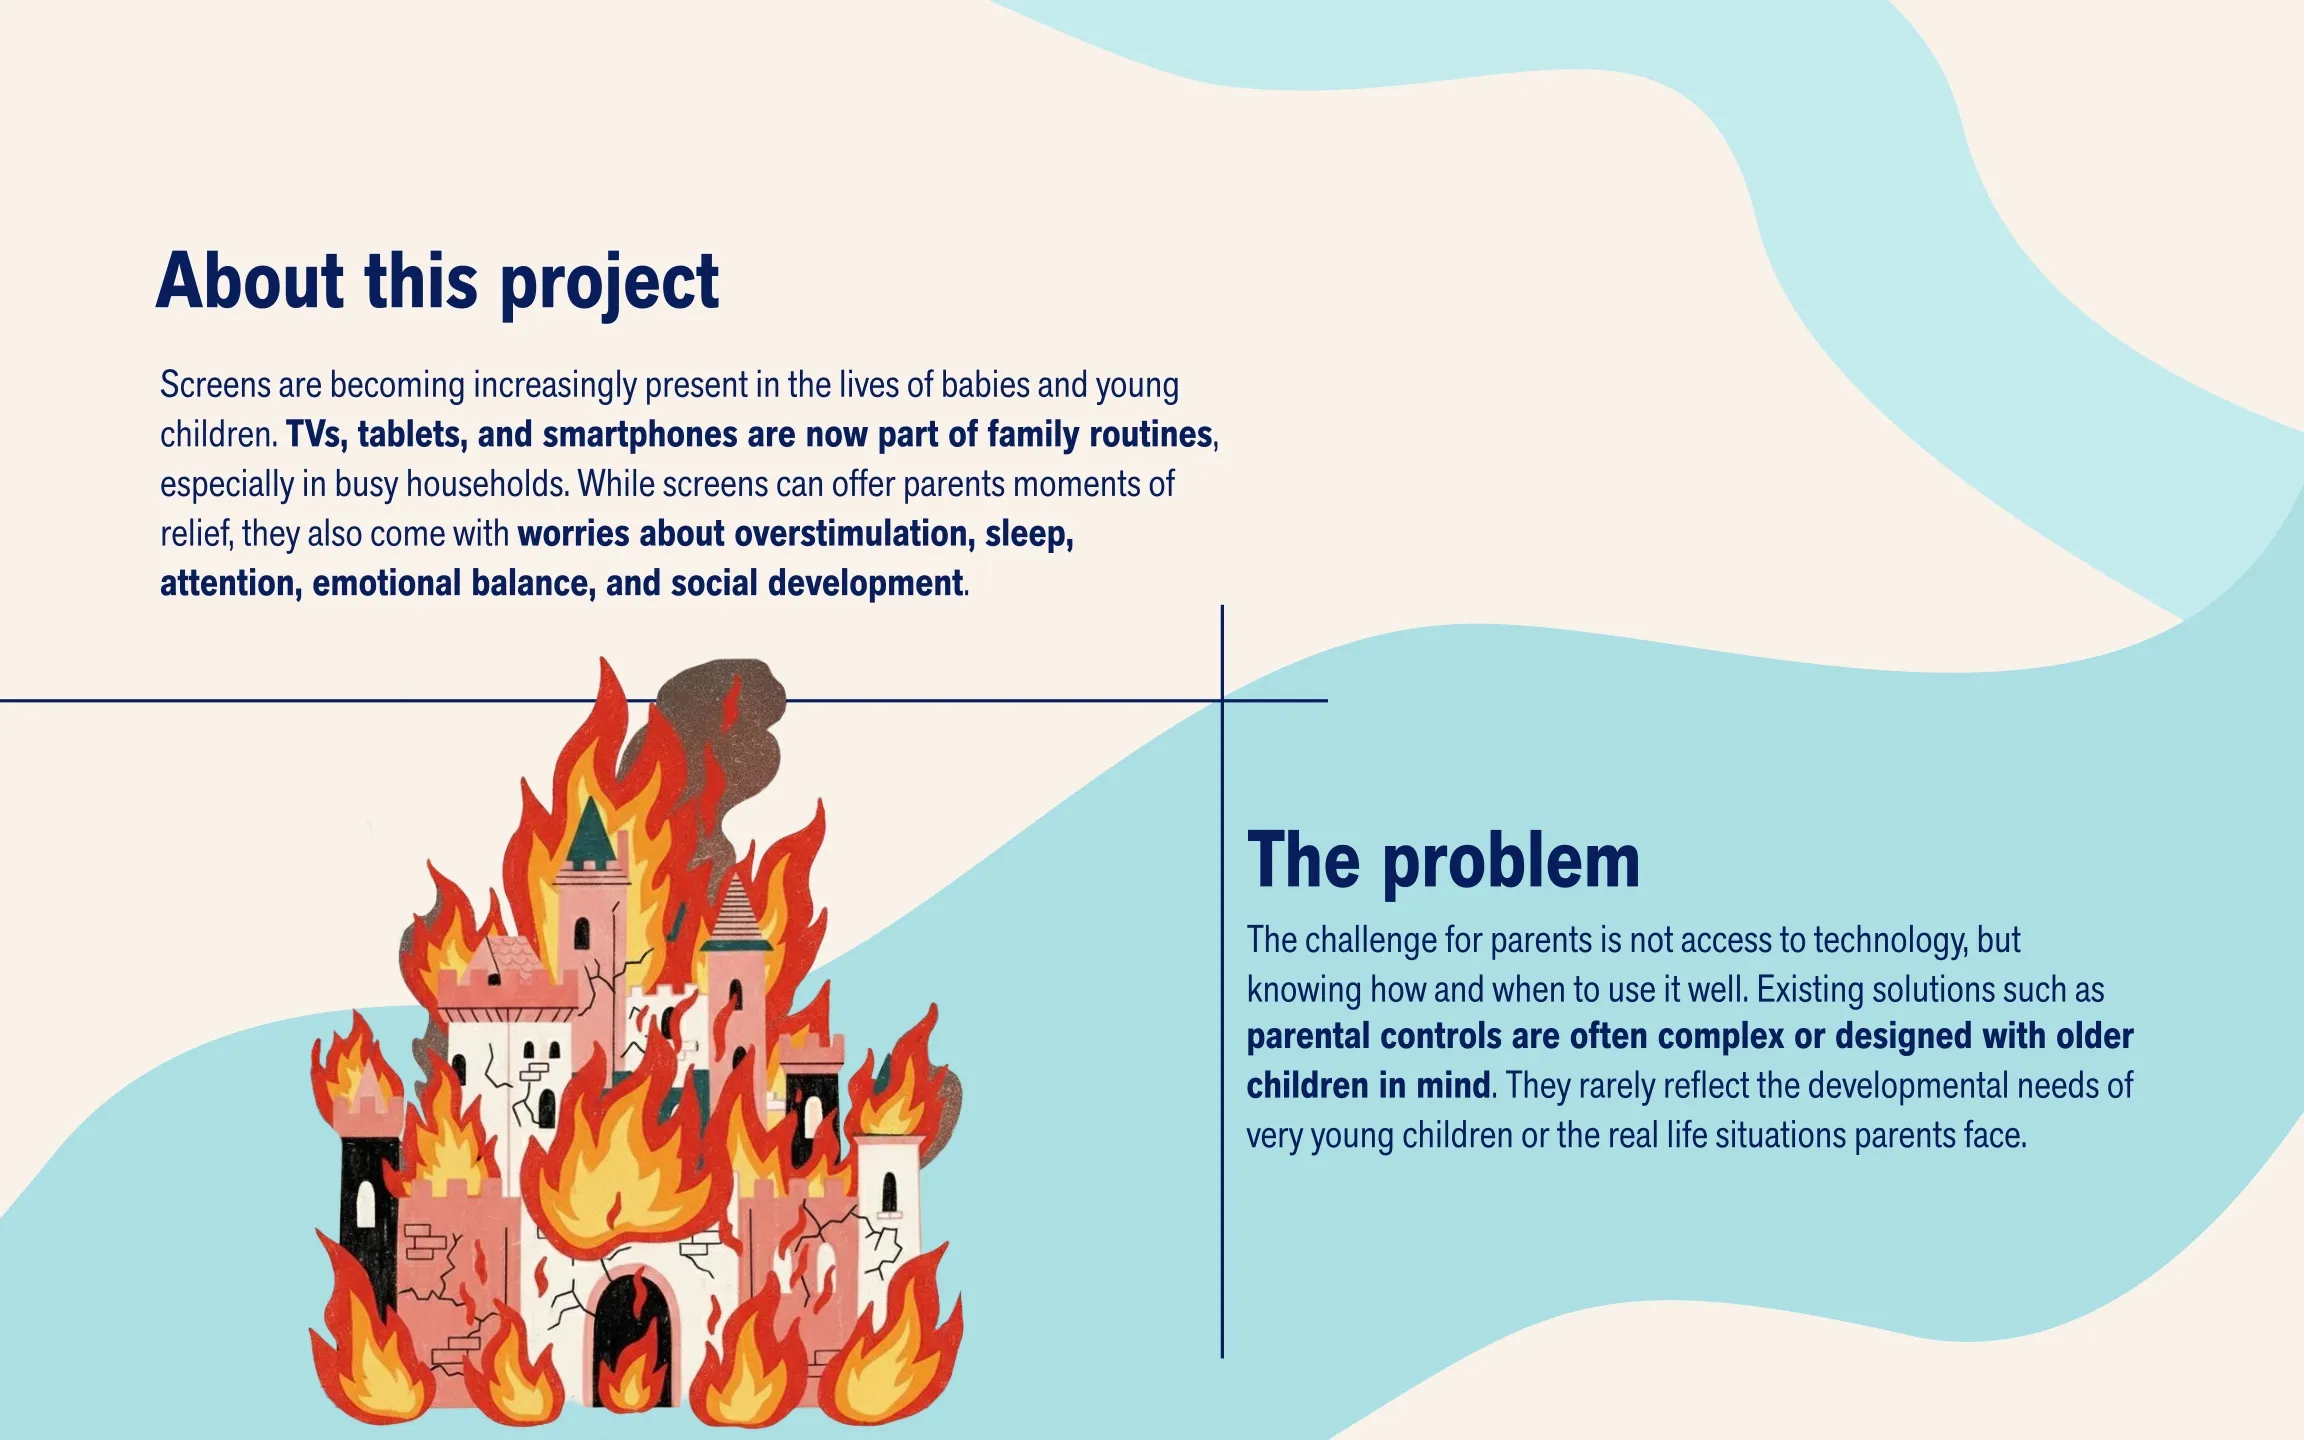
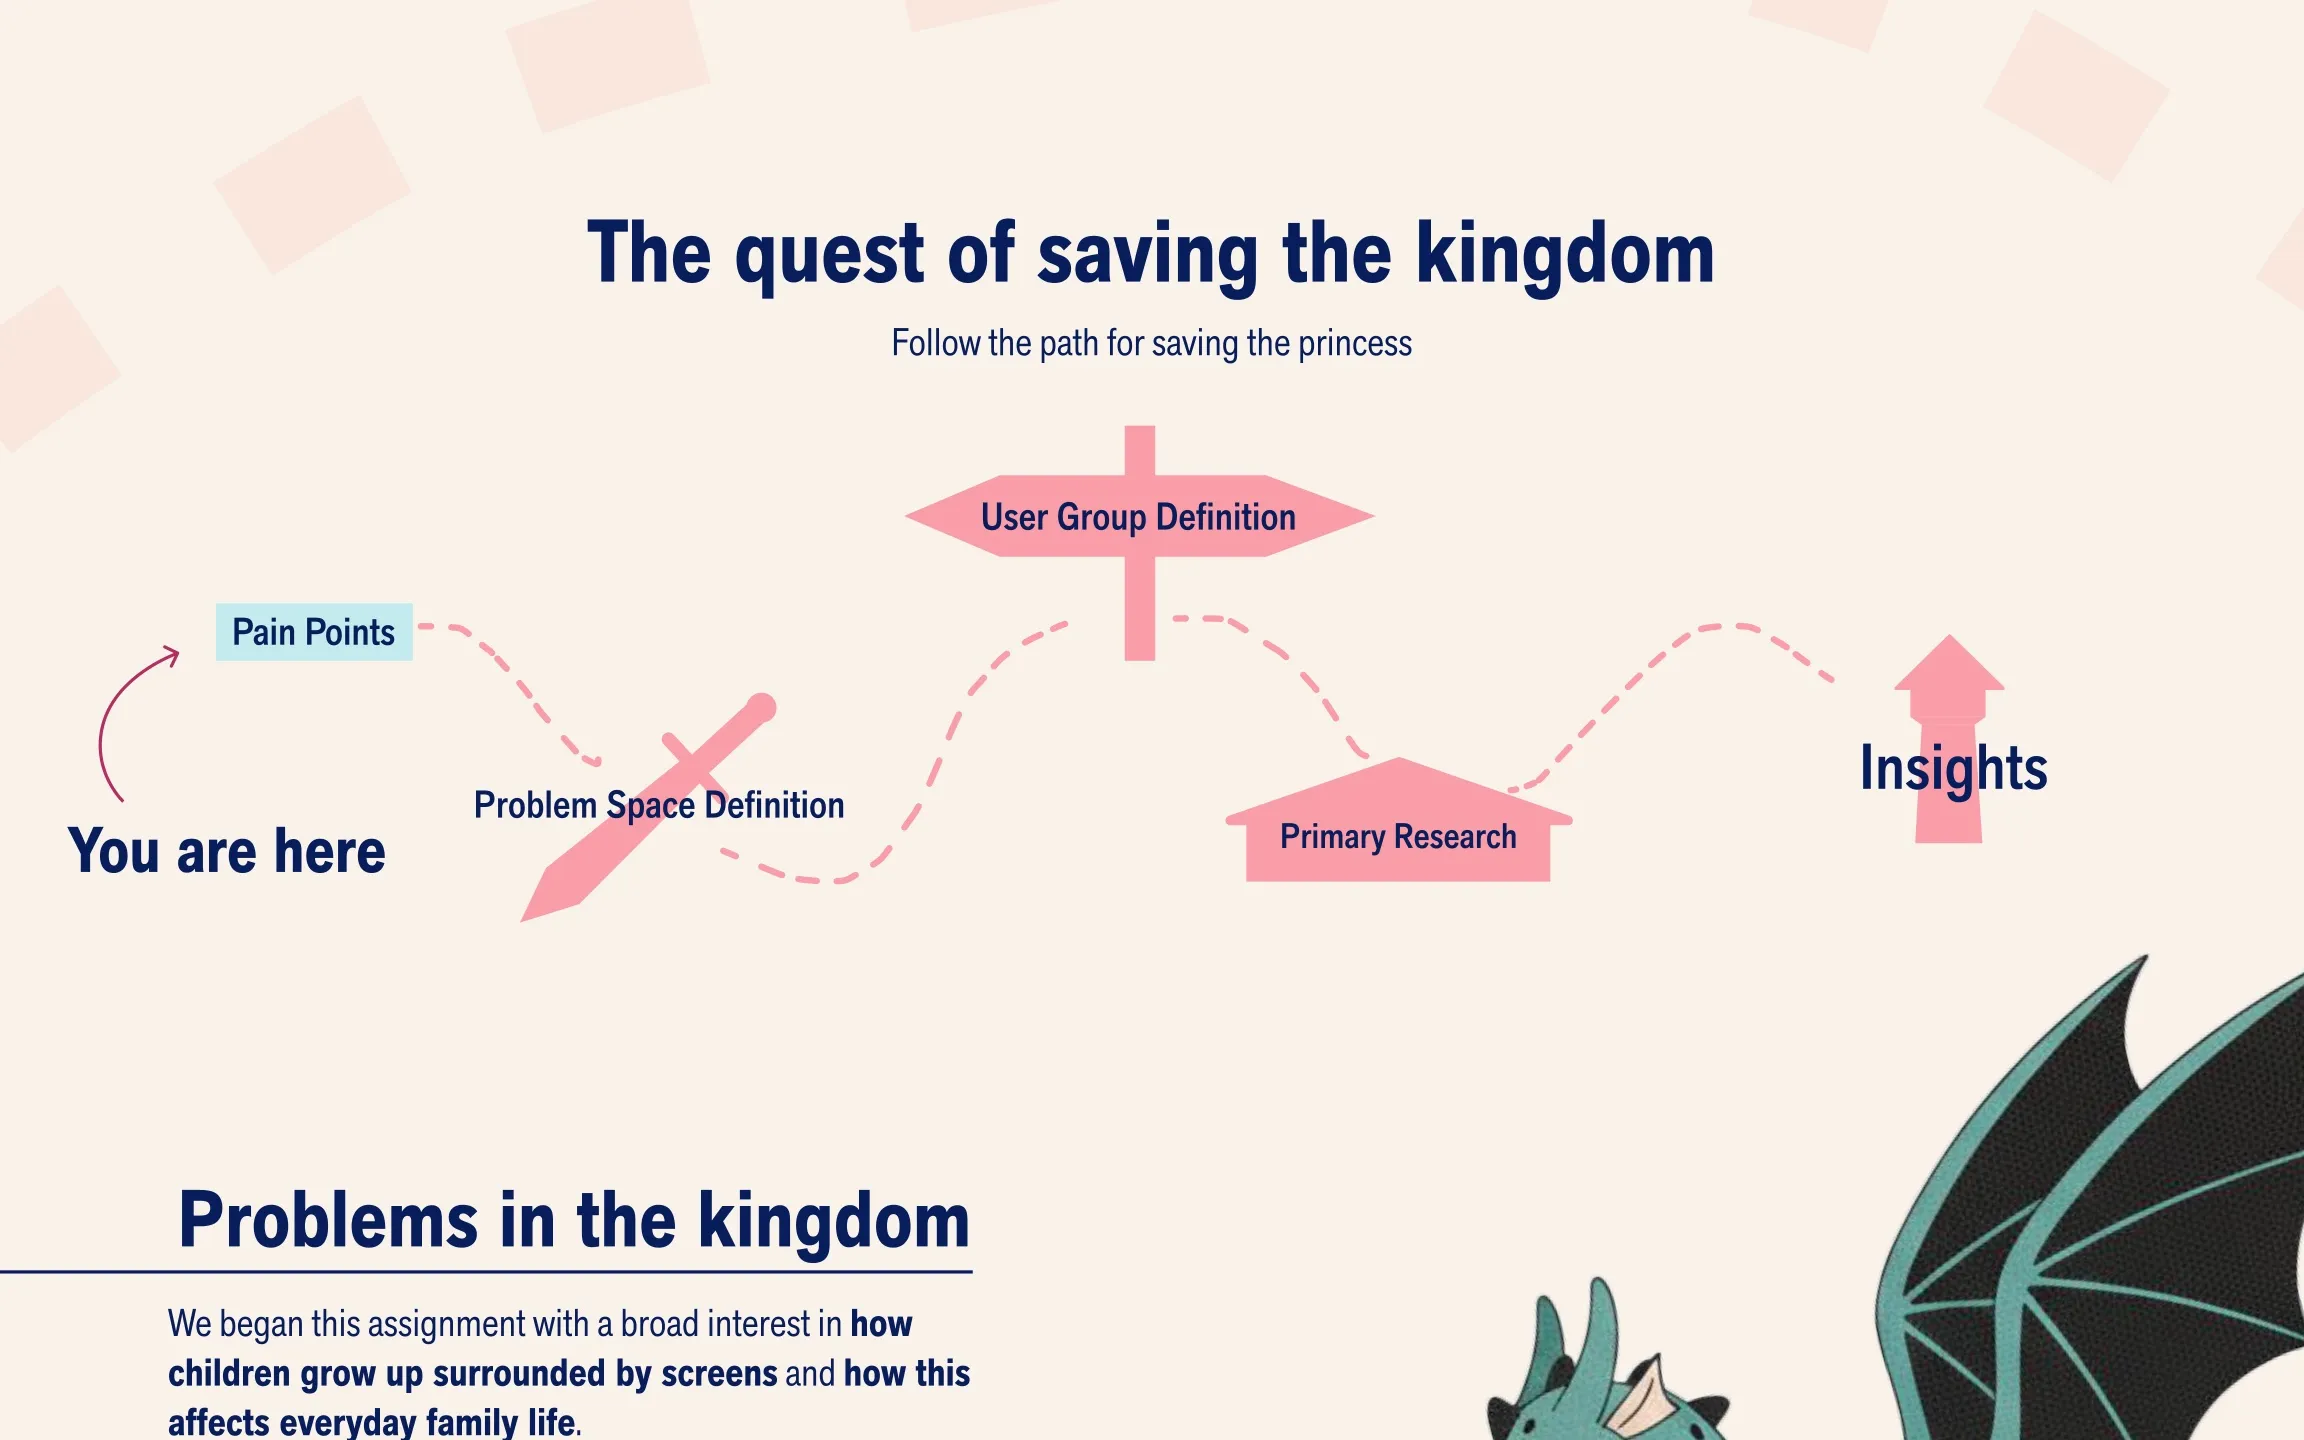
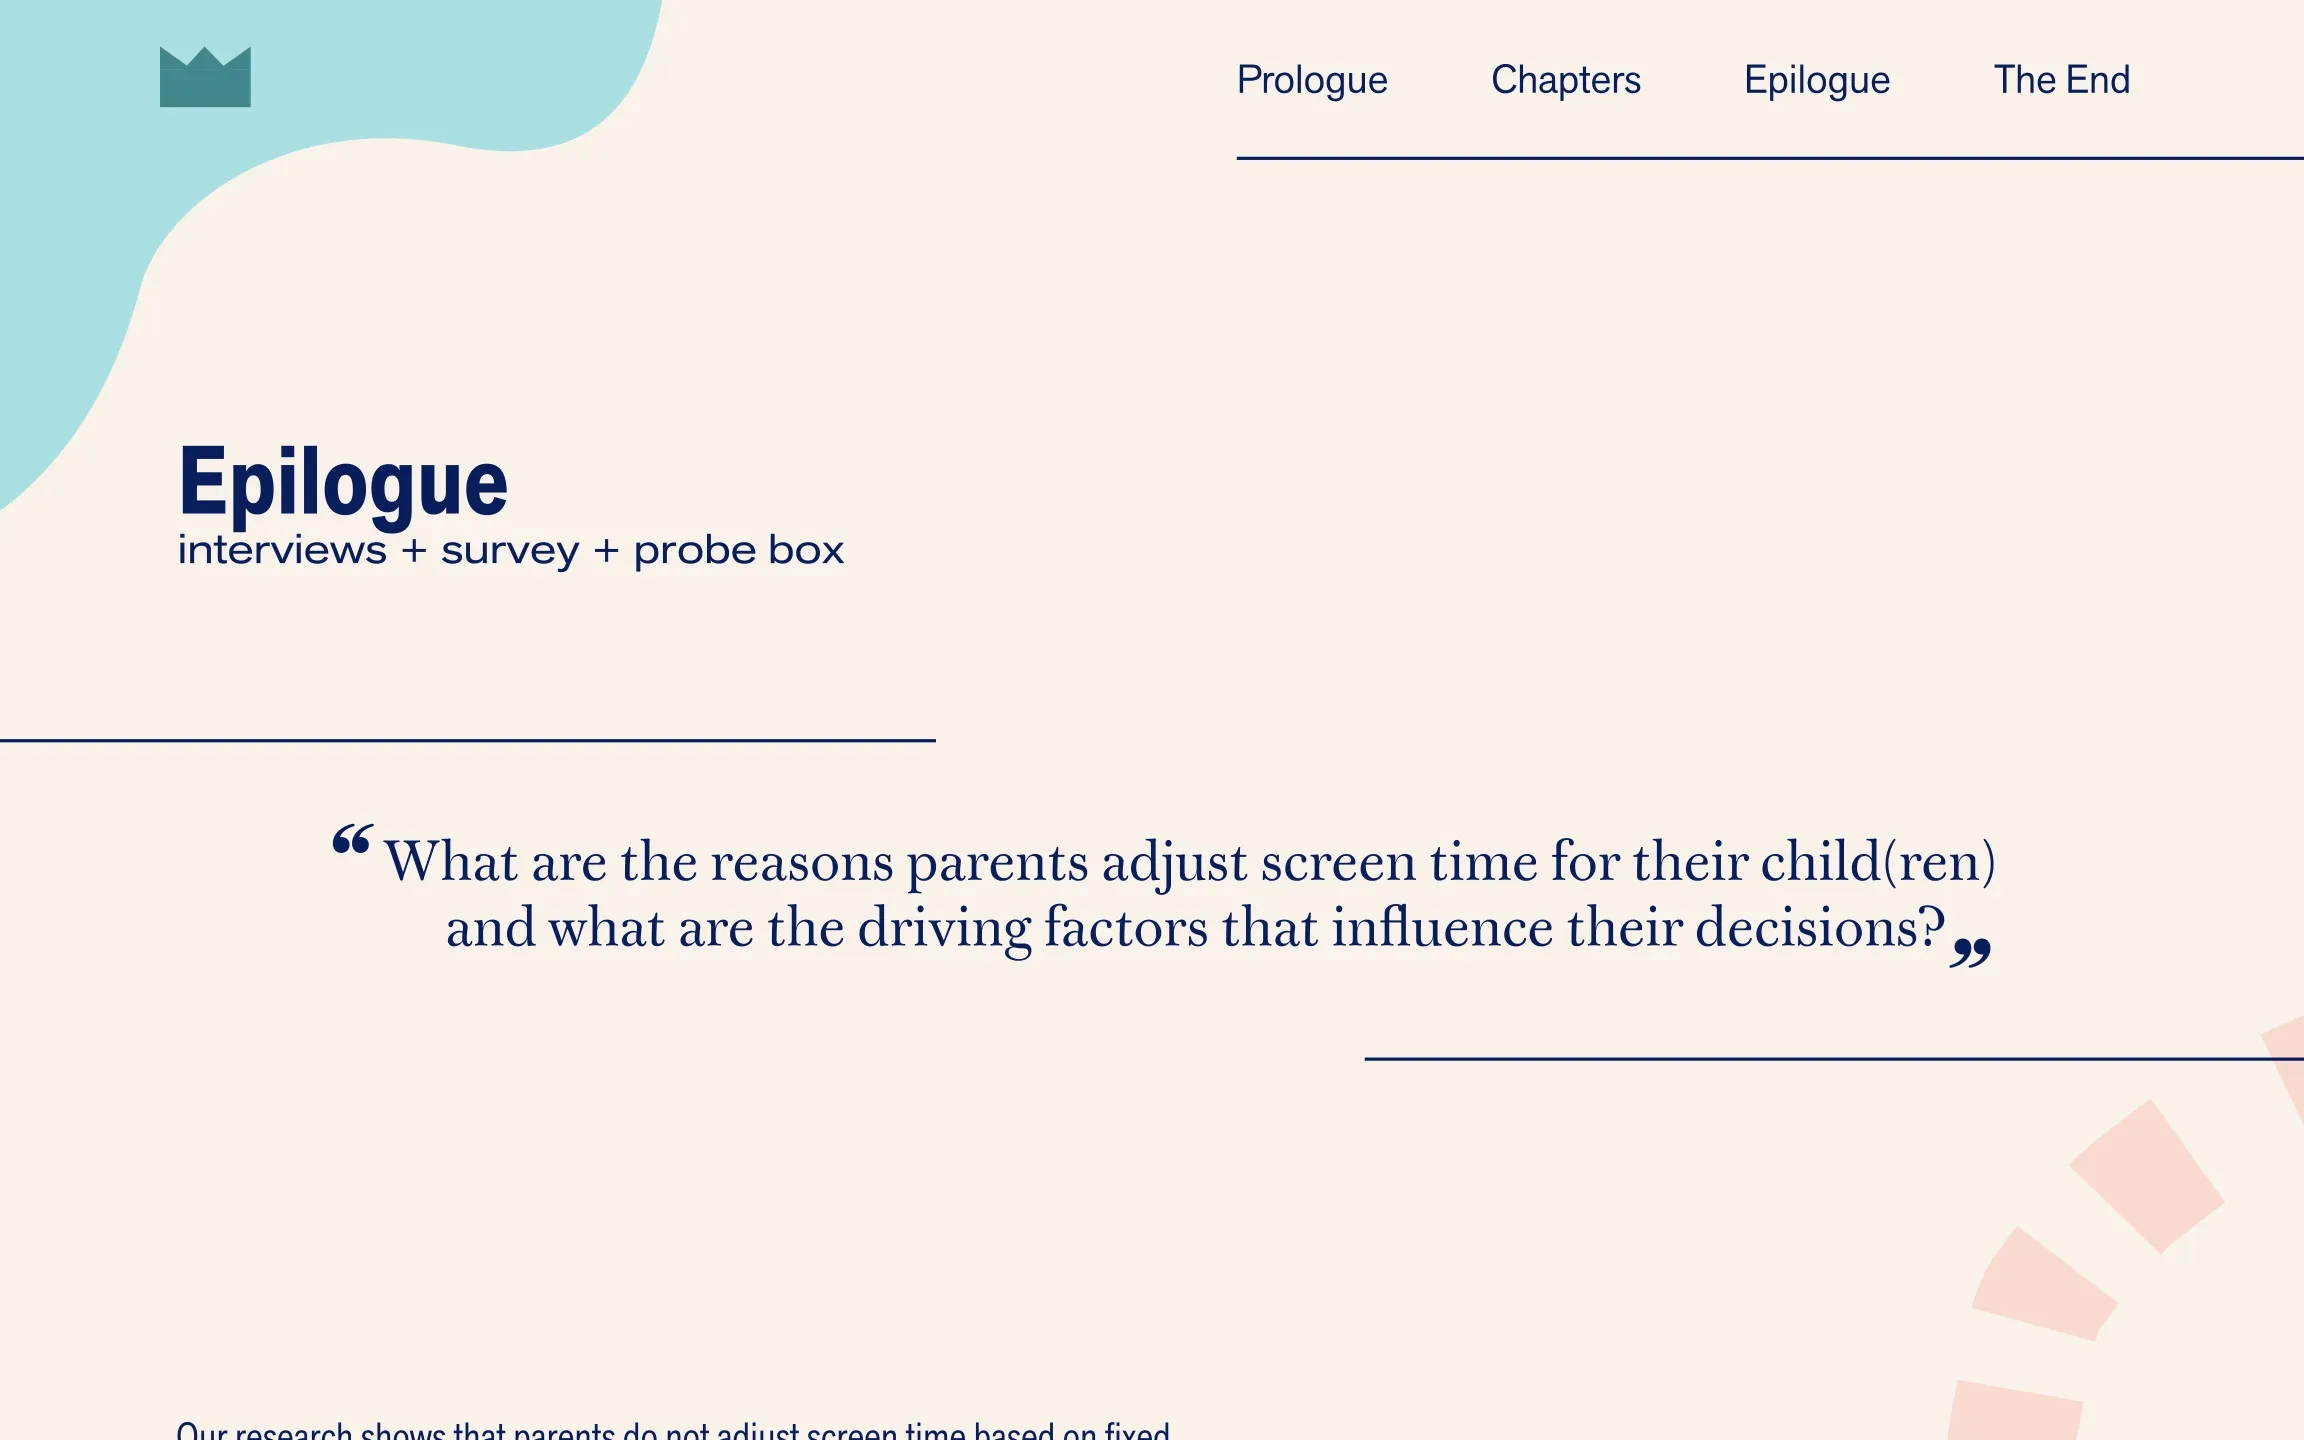
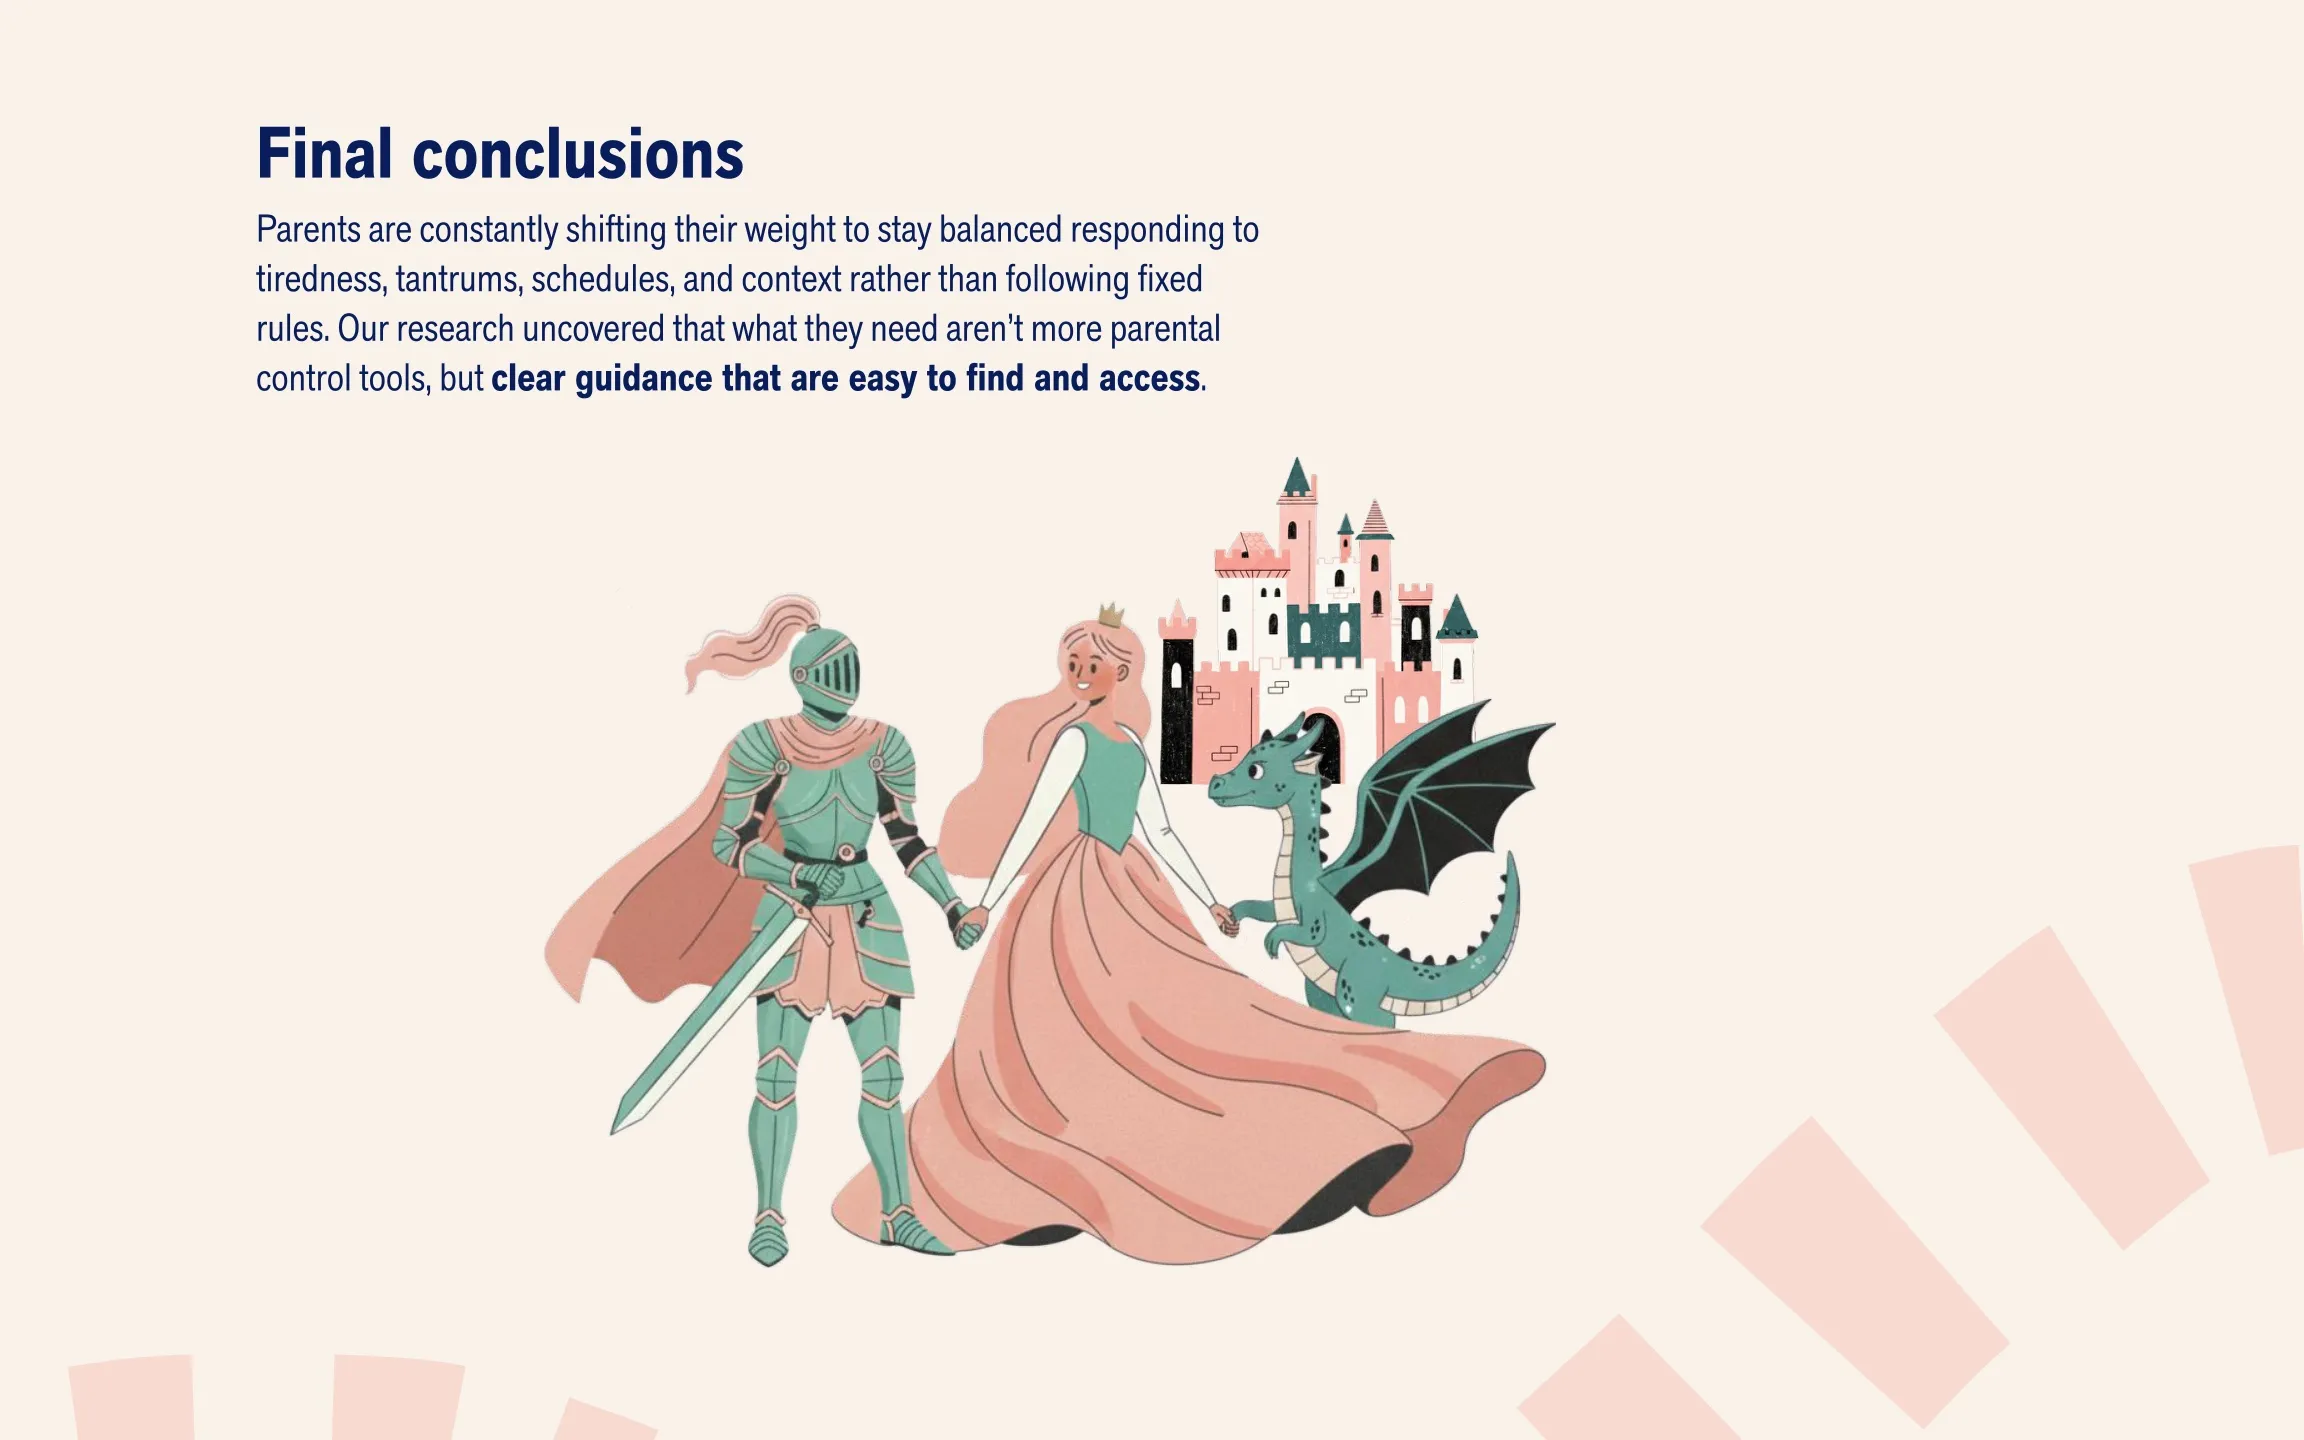
The storybook website: the burning castle, the quest map, the epilogue and the happy ending.
The answer to our question: parents don’t follow fixed rules. They keep adjusting, depending on how tired they are, tantrums, the schedule and what their child is like that day. What they watch matters more to them than how long. They’d rather sit with their child than rely on parental control apps. And even confident parents feel guilty and unsure. What they need isn’t more control tools, but clear guidance that’s easy to find.
We also wrote down where future research could go: what parents could do instead of screens in busy moments, how local organisations could give clearer guidance, screen time for neurodivergent children, and how much parents trust parental control apps.
Parents in our interviews kept asking what the official recommendations are, so we added this chart at the end of the site for them.
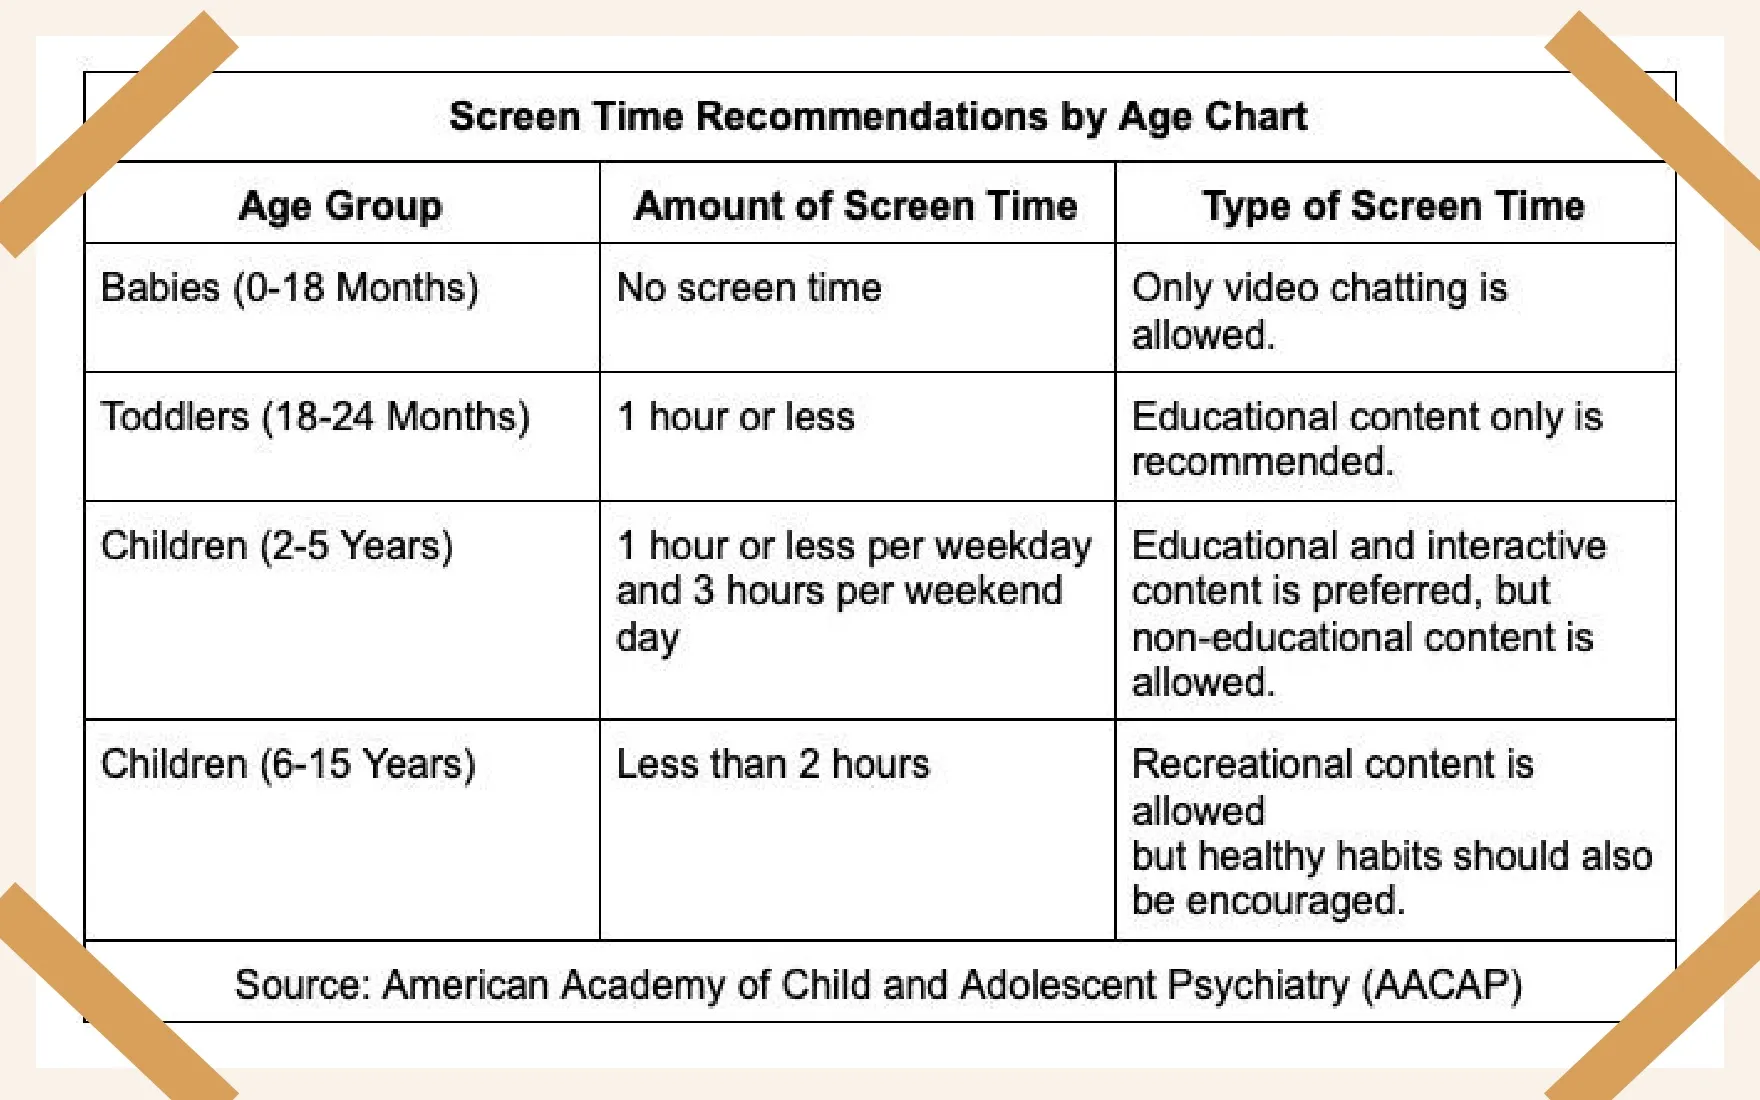
The bonus at the end of our site, because the parents asked for it.